5 Filters

Vaccine excess deaths pg.94

Continuing the discussion from Excess deaths from covid vaccine - where are they?:

Hi ED

just trying to get back to this topic that you’ve raised a couple times now. I have a couple of questions as I’m trying to understand your reasoning here.

I’m not sure I get this point. How do we already know this?

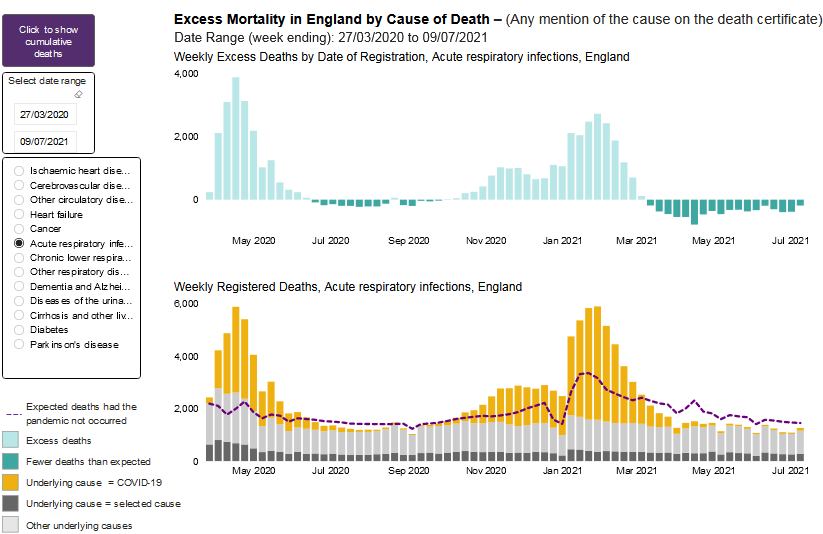
So are you suggesting that any shortfall in death for a given category (acute respiratory infection for example) means that those deaths were mis-attributed to covid? Keeping the acute respiratory infection category as an example, does that mean that if the 5 year average for November 20th (say) was 2000 deaths, and we only recorded 1000 deaths on 20-Nov-2020, then that “missing” 1000 were incorrectly pushed into the Covid category, thereby inflating the Covid deaths but artificially deflating acute respiratory infection deaths?

I’m trying to follow the main thrust of your argument, so please correct me if I’ve already got it wrong…I’m probably missing an important point here. I’ll continue my thoughts on that when I feel like I’ve understood you better.

Moving on,

Interesting thought. Firstly we would have to agree that a large number of deaths must have occurred for this to happen. That’s a point of agreement at least - a lot of people died of covid. (Perhaps even enough to skew the life expectancy in England :wink: ). Whether that would affect the 5-year average enough to hide any vaccine deaths is debatable. It depends on how many vaccine deaths there were. If the number is really in the 10s of thousands then I would still expect that to be visible. I haven’t gone through the trouble of reproducing the 5 year average and checking, but it would be an interesting exercise to do when I have time. Certainly some of the figures that have popped up on this forum from places like VAERS are coming up with deaths in the 10s - 100s of thousands (even millions, worldwide). There is nowhere for numbers that big to hide… I would expect to see them in the all cause mortality. Additionally, between March and June 2020, we officially recorded something like 40K deaths UK wide, less than a third of the total official Covid death toll so far. I’m really not sure that’s enough to hide 10s of thousands of vaccine deaths in 2021.

I don’t think I follow you here. What extra deaths following vaccination? Covid deaths? Think I’m missing something…

This is precisely the point I was raising. If thousands of people are dying because of the vaccines, then however they are being categorised, they should show up in all-cause mortality. Given that all-cause mortality was coming down as the vaccine program was ramping up then I’m left wondering where these deaths are hiding?

Sorry for the all the questions. Hoping that you can help me get to the main point you’re making here.

Cheers
PP

1 Like

Hi PP.

Not much time ATM but I can hopefully answer your first questions (the ones before you get on to “Moving on” to vaccines).

The situation I describe (explain/made up/bluff with) arises when the five-year average lies some way between the total deaths and the total deaths excluding covid. Like the lower graph below

No, in my scenario three numbers are at play:

Let’s just assume the the weekly deaths were 3000, broken down as follows:

the non-covid deaths 2000, the five-year average 2500 and the covid deaths 1000.
(Imagine them in the graph with the covid on top in yellow, and the 5-year average as a dotted line)

Then there are 500 excess deaths; but if covid were responsible for all of them, that means that if covid hadn’t happened there would be 500 fewer deaths than the five-year average.

If this is happening across all or almost all the causes of death, the problem clearly is the allocation of covid deaths.

(To re-state; the proposition that the people making up the 1000 covid deaths would be alive if it wasn’t for covid necessarily implies that there would then have been this shortfall of 500 deaths).

The practical explanation of why this should be is at hand as well - the two scenarios in this graph are also explained by the diametrically opposite testing policy at the time of these two peaks. In the first wave they were mainly testing people with illness, whereas in later waves they were testing as many as possible. The latter is bound to lead to false positives, or people with Sars-cov2 that aren’t ill.

In addition, in the second wave many would have been testing positive due to past infection, fragments etc. But in the first wave people hadn’t had time to get covid, recover and then get it again.

I think these reasons crack it, though I’m not sure if I’ve put them in the most logical order!
I’d be interested so see if you agree.
Cheers

1 Like

Thanks for that ED, your point is pretty clear now.

The first thought I have is that it’s not obvious to me that a shortfall in deaths in any particular illness category leads to the concrete conclusion that the Covid deaths are overstated.

I get your point that if we subtract all the official covid deaths, then fewer people than expected would have died from heart disease or respiratory illness etc. It just seems to me that there are alternative explanations for that which don’t involve overcounting covid, and which seem very reasonable to me.

For example, there is definitely an overlap between people suffering with some particular illness and the notion of comorbidity. Someone is much more likely to die if they are already ill with something like heart disease, and then get Covid on top.

In such a situation, we would expect a whole bunch (technical term there!) of people sick with serious heart failure to die, should they get covid. Given that covid was the thing that finished them off, albeit in their pre-weakened state, then that gets counted as a covid death. In the absence of covid, that person may well have gone on to die anyway, but it would then be counted as a death from a heart attack or what have you.

Because of the interaction between covid and these comorbidities, the problem is subadditive. We can’t just do a simple subtraction without accounting for the interactivity.

There are other things at play here too. Respiratory illness, flu for example, was driven to almost zero by the actions of people locking down, social distancing, wearing masks etc. It’s not surprising that we are below the 5 year average for that.

I guess the point I’m making is that there are good reasons to expect that we would be below the 5 year average if we simply remove covid deaths, or covid responses from the equation in 2020. And it doesn’t require that the Covid numbers be inflated in any way.

I gotta head out now, but I’ll pick up again later. I have some thoughts about vaccine deaths hiding in the excess mortality numbers.

Thanks for taking the time to explain your thoughts so clearly. I’ll keep trying to follow your example!

Cheers
PP

Hi again PP

and
"For example, there is definitely an overlap between people suffering with some particular illness and the notion of comorbidity. Someone is much more likely to die if they are already ill with something like heart disease, and then get Covid on top.

In such a situation, we would expect a whole bunch (technical term there!) of people sick with serious heart failure to die, should they get covid. Given that covid was the thing that finished them off, albeit in their pre-weakened state, then that gets counted as a covid death. In the absence of covid, that person may well have gone on to die anyway, but it would then be counted as a death from a heart attack or what have you."

But if covid finished them off then it’s counted as a covid death, or covid-related. Wouldn’t have died at this point but for covid, is the idea.

If you remove all covid-related deaths there is a shortfall.
That is the same as saying the covid-related deaths are overcounted!

Thinking of another way…In producing these ‘covid deaths’ no account is taken of interaction between covid and serious co-morbidities… The interaction is implicitly counted as zero…
…thereby we arrive at the maximum number of covid-related deaths possible from the data.
So is necessarily an overcount.

Bringing in the excess deaths is a necessary step to validate the data breakdown. You can’t appeal to this interaction on the way down, having called it zero it on the way up, if you see what I mean :grimacing:

" There are other things at play here too. Respiratory illness, flu for example, was driven to almost zero by the actions of people locking down, social distancing, wearing masks etc. It’s not surprising that we are below the 5 year average for that."

The graph for acute respiratory is the same.
To see it you have to go to the link
https://app.powerbi.com/view?r=eyJrIjoiYmUwNmFhMjYtNGZhYS00NDk2LWFlMTAtOTg0OGNhNmFiNGM0IiwidCI6ImVlNGUxNDk5LTRhMzUtNGIyZS1hZDQ3LTVmM2NmOWRlODY2NiIsImMiOjh9
…and on the pages, click all the way along to ‘8 of 9’. Then select illnesses.

But the other serious diseases are the same.

" I guess the point I’m making is that there are good reasons to expect that we would be below the 5 year average if we simply remove covid deaths, or covid responses from the equation in 2020. And it doesn’t require that the Covid numbers be inflated in any way."

That doesn’t take into account deaths caused by covid policies. Eg - all the excess home deaths, remember? You can’t introduce one-sided entities in a genuine accounting process, without considering what might lie on the other side of the balance sheet!?

It’s possible to surmise complications in a data set but I honestly don’t see how the picture could be more striking. I’ll probably leave it there rather than try to develop something else (vaccine deaths) in the context of something that you don’t think exists.

Thanks for putting my stuff into your brain!

Cheers
ED

Hiya ED. Appreciate your further thoughts on this important subject. I think we’ve got some clarity on our positions, which is a good thing.

But how can we remove covid related deaths while keeping track of the interactions I mentioned? One can’t just subtract out the numbers… I’m pretty sure that doesn’t work, as I try to explain below.

I disagree. As I said, a patient can be ill with heart disease, get covid and covid will kill that patient because they are already weakened by heart disease. That is not overcounting covid. It would be less accurate, I think, to say that this person died of heart disease, if it was covid and blood clots etc that ultimately killed them. In any case, as we discussed at length before, the comorbidities are recorded as part of the patient’s record.

I don’t think I agree here either. We already know that certain comorbidities imply that covid is a lot more fatal for some people than others. That is explicitly taking account of the the interactions, not ignoring them. Comorbidities are recorded when a patient dies of covid. That’s how we know which comorbidities are most dangerous… I’ve seen tables of such things. The whole UK policy of “shielding” for the vulnerable was explicitly taking the interaction of covid and other disease into consideration. That was how vulnerable people were identified in the first place.

I do see what you mean, but I don’t think that’s happening. As far as I can see, the covid deaths do take into account comorbidities and specific policies have been created to try and handle the interactions I’m talking about. There are lots of public statements about which people are more at risk due to existing conditions.

Summarising this piece, then, it really isn’t clear to me that the Covid deaths are overcounted. It’s just natural that already seriously ill people will die of covid at a higher rate during a pandemic. If there was no pandemic then some of those would have died anyway, but it just so happens that they died of covid this year. This suggests to me that we just cannot automatically assume that mortality would be below the 5-year average if covid had not happened. It feels mathematically incorrect to say that simply subtracting out all covid deaths from the total shows what would have happened in the absence of covid. It’s more complicated than that.

I’m interested in this piece that you raise

Can you remind me what the argument about extra home deaths was again? Do we not think these deaths are also covid? Was there data suggesting other causes of death? And I’m also interested in any data that covid policies led to a lot of extra deaths. I’ve followed this discussion all year but I’ve yet to see significant data on it. If you’ve come across any data, I’m very keen to see it.

If there isn’t a significant overcounting of covid deaths then I’m back to wondering where the large numbers of vaccine deaths are? In just about every country I’ve looked at (DE, PT, ES, UK, FR, IS etc) deaths follow covid waves. The vaccine rollout simply ramps upwards from the early part of 2021 through the rest of the year, but in just about all cases, all-cause mortality drops over the course of the year.

I do see a correlation of mortality and covid cases, but I don’t see any correlation between mortality and vaccine rollout.

I’ll take some time soon and have a quantitative look at just what the numerical correlation coefficients are, but from simply eyeballing the data I don’t see it. My eyes might not be as good as they were though…:wink:

Thanks for the thoughts bwana. And thanks for your patience with me. I know I should have looked at all this ages ago. These are important discussions, I think.

Cheers
PP

Hi PP

“But how can we remove covid related deaths while keeping track of the interactions I mentioned? One can’t just subtract out the numbers… I’m pretty sure that doesn’t work, as I try to explain below.”

As I said last time, “Wouldn’t have died at this point but for covid, is the idea.”

You can remove them because you are saying covid killed them. You need to remove them to see what would have happened had there been no covid. And when removing them means there is a surprisingly low number of deaths left, the obvious explanation is that you removed too many, i.e. that covid didn’t kill all the ones you removed.

On Deaths at home, it might be worth reading our last exchange again. I posted a graph showing that only at home were the excess deaths actually positive.

I also posted this:

"The covid deaths will have to come down as there are only so many excess deaths to go round. And 70K of them were in private homes (mostly not covid): "

referring to this:

“At least 70,602 excess deaths in homes were registered between 7 March, 2020 and 17 September, 2021 across England and Wales.”

This takes a huge chunk out of the claimed total for covid deaths.

It’s not the only chunk to come out…This was a discussion about a claim you posted that covid had shortened life expectancy.
The PHE report that was the source of this claim (made by a Dr in the BMJ, who added a little spin) said this:

“PHE routinely produces a weekly excess mortality report (4), which provides a breakdown of excess mortality by age, region, local authority, deprivation and ethnicity. These reports show that over the course of the pandemic to 2 July 2021, there were almost 91,000 excess deaths registered in England. This is lower than the total number of deaths involving COVID-19 up to this date (132,740) because some of these deaths involving COVID-19 would have been expected had the pandemic not happened (4).”

Only 90,000 excess deaths? (OK, 100,000 UK)
So it seems to me that covid deaths and excess deaths (in 2020 especially) need to be re-thought.

I don’t think excess deaths is a good way to try to analyze vaccine deaths, there are too many uncertain components to the former, it would all be a blur. Also it’s the preferred industry method for a reason - needle in a haystack, easy to hide effects. It’s biased - you might not find vaccine deaths at population level due to the uncertainties; yet it could be more than covid deaths.
There are stronger signals of vaccine deaths coming out, I think. I don’t want to spend time on a weak one!

Cheers
ED

1 Like

Evening, ED, thanks for the extra info. I’ll have a read later tonight.

Sticking to the main point, though.

You can only remove them if you take account of the interactions, otherwise you get a false picture, as I’ve pointed out already. Simply subtracting the numbers doesn’t tell you “what would have happened had there been no covid” accurately. That’s not the right way to do that. The best prediction of what would have happened in the absence of covid is the 5-year average. Carefully (and correctly) removing the effects of covid from 2020 would bring mortality close to that line.

Hmmm… I feel like I’ve addressed this point in some detail already, so I won’t do it again. It’s not a surprisingly low number of deaths unless you do it wrong and fail to take account of the subadditive nature of the problem.

It’s interesting that the quote you shared from PHE is making the exact same point that I am - and I missed the nuance of it the first time round.

This is what I was arguing above. PHE and I agree on this.

Put simply, I don’t see any evidence indicating that covid deaths have been overcounted. Especially as the number of covid deaths isn’t inferred from excess deaths in any case, it comes from counts of death certificates. I don’t know why we would need to re-think covid deaths if a recalculation of the excess deaths change. The death certs are written.

It’s important to restate that

excess deaths ≠ covid deaths,

and we shouldn’t mix those up. It’s not the case that if we see excess deaths rising in some category we must reduce covid deaths to compensate. Covid deaths are those deaths that were judged on the death certificate to be caused by covid.

The only reason I’m looking at excess deaths right now is to find a signal for the hypothesised vaccine deaths. It’s a way to get behind the propaganda in case governments are trying to hide vaccine deaths somehow by calling them something else. If it were the case that vaccines were killing many thousands (millions!) of people, we should see that as a rise in mortality figures as the vaccines get rolled out.

But, look as I might, I just don’t see that trend in any dataset in any country in the world that I’ve looked at… Zero actual data signal for mass vaccine deaths.

I could be missing something of course. I’m always happy to be shown that I’m wrong, as I have been on different questions before. I do think it would be worth calculating the correlation between the vaccine rollout and actual mortality. In particular I would be interested to see how good a regressor vaccine rollout is as a predictor of mortality. That would add some actual hard data to the question at hand. I’ll have a go when I have a mo.

In the meantime, thanks for the extra data on home deaths. I’ll have a read and a think about that.

Cheers
PP

PS

Surely looking at all-cause mortality is by far the best way to judge if people are dying? It’s the only reliable way that I can think of… And looking for excess deaths there is would be a definite signal that something is going wrong. The covid signal is unmistakable, for example.

What are you thinking of here?
Cheers

Hi again PP

You can subtract anything that you added on, especially if it’s for the purposes of seeing if it’s sensible. Not to do that kind of test with all the wooliness in the definitions of the data is kind of neglectful imo. And when you do it and the outcome doesn’t seem sensible (despite two very good reasons I gave you, both of which distinguished between the two waves) I think it should give pause for thought.

“You can only remove them if you take account of the interactions, otherwise you get a false picture, as I’ve pointed out already.”

Yes but to ignore interactions for the purposes of counting the covid deaths (a line you’ve held all along in these discussions), but regard them as sacrosanct for the purposes of bolstering them is false accounting. I’ve said that already too…

“Put simply, I don’t see any evidence indicating that covid deaths have been overcounted.”

Well in the last thread you put them at 150K and PHE who you agree with say there are only about 100K excess deaths. And the 70K deaths in private homes you only don’t see because you’ve still to read it…
Basically .I’ve never seen a more dubious counting construct in my life than the covid deaths count (I won’t go into defintions of covid, PCR, high CT cycles, with/of covid and all that) but there is more than enough empirical reason to doubt the scale.
That’s not to say there haven’t been lots of ‘covid deaths’ but we don’t need to believe any old claim.

"It’s important to restate that

excess deaths ≠ covid deaths"

Why do you state that? It was consideration of the excess deaths that sparked my first endeavours in this area. I’ve had to post that graph with the five year average several times.

Hmm, time to agree to differ I think! I feel anything significant is being quickly forgotten, but maybe you feel the same. Anyway I didn’t mean to spend this time on this old ground, it probably was unwise.

Vaccine deaths
There have been a few analyses of vaccine deaths on this forum, like this posted recently.

(Interesting that Steve Kirsh had come to the same conclusion using back-of-the-envelope methods). Some of them you have already given your royal dissent to! But I think they could still be more promising starting points for you.

They are all pieces of the puzzle. Vaccination data is complicated due to confounders like age (most people dying are vaccinated, due to age), and covid itself. And the excess deaths have too many uncertain big contributors.
Drilling down into detail is more promising than trying to read it from the top in my view.
I really must leave it there
Cheers

Thanks ED

Happy to leave it there. Have a think about what I’m saying and I’ll do the same. I feel like I’ve understood what you were saying, which is good progress for me!

I did start reading the Zelenko report, but found it frustrating for several reasons. Not the least of which a death toll as high as they are talking about should show up somewhere…and it doesn’t as far as I can see.

Anyway. I’m sure this subject is not concluded. See you down the rabbit hole in another thread!

Cheers
PP

Someone has already had a go at looking at correlation of deaths Vs vaccination level to see if higher vaccinations lead to more recorded deaths.

Zero correlation found between vaxx % and deaths. If hundreds of thousands (or more) people were dying from vaccinations we should see some sort of indication of that in the data here - more vaxxed → more deaths.

I have some questions about this analysis, and will probably redo it anyway, but seeing as we were just talking about this, I thought it was interesting.

Cheers
PP

Morning PP
So…vaccination has not in fact saved millions of deaths. Well done that man!
Or if it has saved millions from dying with covid, it has killed millions from other causes.

OK…it’s a terrible analysis, means nothing whatsoever. To the initiated, this should really be…obvious!?
My question would be why is someone in a technical field trying to deceive unwary people?

That’s not how I read the analysis. There are countries with high z-scores, but no trend with vaccination. If you look at covid deaths Vs vaccination there is a clear trend.

Vaccinations save people from Covid deaths but are zero correlated with higher death rates.

That was my first reading of the data, but add I said I think I’ll have a go at looking at the data myself.

Hi PP

“Vaccinations save people from Covid deaths but are zero correlated with higher death rates.”

Though the comparison was with 2020,the two covid years, the analysis doesn’t mention covid - if you have a point about covid, you sure didn’t find it there!

Simply: “Vaccinations have no effect on overall mortality” means “vaccinations didn’t save vast numbers of deaths”.

Let’s forget that analysis I’m sure you’d do better…it’s possible the vaccines were saving covid deaths while causing other deaths. That might lead to a low correlation on one side or the other.
Basically adding up two opposing entities to look at the difference is a bit hopeful, relying on one dominating the other to give a clear outcome. Even if done properly, you won’t get statistical significance, all looks suspect.

Not considering covid is a grievous error (OK I forgot to forget it :slightly_smiling_face:) as many countries went through a second peak before their vaccination programme could affect much of their population. So if they then registered high vaccination rates and low covid deaths after the curve came down, it would be hugely flattering to the vaccines. This happened in the UK and US for example - thoughthey weren’t included in the correlation.

I don’t think your contention that vaccinations save people even from covid will be supported by data if you don’t adjust for age, as the unvaxxed population are younger. Getting age breakdowns of deaths and vaccinations for all those countries might be tricky.
Unvaxxed populations can be hard to pin down - perhaps relying on subtraction from census data, when which data set you use can make a big difference to a small remainder, a point Dr Spiegelhalter made in the G.

I hope there’s something helpful there (to offset any unhelpfulness there could be :slightly_smiling_face:) I think beavering away on one or two familiar countries is a more promising approach, but good luck!
Cheers

Hi bwana

Super quick for now

I’m not sure I agree. I’ll go into more detail when I get to writing about correlation at some point. The point is connected to the idea that vaccinations should break the link between covid and death, leaving most deaths to be non-covid related and uncorrelated to the vaccine above a certain point. I’ll think more carefully about this and say more about it later.

It’s interesting though, the there is no correlation between high vaxx and high mortality. This is the opposite situation to the one above. If the vaxx was causing deaths then the more we vaxx the more should die. We are adding a cause or mortality to the overall picture rather than removing one.

Anyway. Thanks for all your thoughts in this thread. I’ll continue to think on the points you bring up. I’ll also have a try at doing some actual data analysis on this subject. However that turns out, I’ll share it when I’m done. It could be interesting for a few of us here…

Cheers
PP

The Twitter piece is a very simple thing. The meaning of the words is clear, and there was no covid mentioned or contained in the analysis to suggest any more subtle interpretation.

"It’s interesting though, the there is no correlation between high vaxx and high mortality. "

This manner of investigation ensured that no correlation would be found - so this is not correct.

" If the vaxx was causing deaths then the more we vaxx the more should die. We are adding a cause or mortality to the overall picture rather than removing one."

I don’t want to harp on (no, really, I dont :slightly_smiling_face:) but have you clocked that there are likely two vaxx effects, one on covid deaths and one on non-covid deaths?
The bright spark who dreamed up this way of ‘proving’ vaccinations are safe has condensed a two dimensional problem into one. And ignored huge confounders: covid waves and peaks, age of vaccination amd age of deaths. It would have been very surprising to get a correlation of any significance!

But I’m sure you’ll do it better :slightly_smiling_face:

Cheers