5 Filters

Never a Pandemic Denis Rancourt paper, plus today's Off-Guardian, any comments?

Denis Rancourt, in Quebec recently published a scientific paper about excess mortality in Canada, which appears to show there was, in fact, no respiratory disease pandemic in Canda.

Today, Off-Guardian published a short article from Catte Black saying that in fact the pandemic is a hoax (not the covid 19 disease per se, the pandemic based on the fraudulent PCR testing system.

I would be very interested in any critique of Rancourt’s paper and the Off-Guardian article.

Do most people on this site think that in fact there was/is NO pandemic?

Can anybody with statistical skills and chart reading skills evaluate the Rancourt article?

https://denisrancourt.ca/entries.php?id=104&name=2021_08_06_analysis_of_all_cause_mortality_by_week_in_canada_2010_2021_by_province_age_and_sex_there_was_no_covid_19_pandemic_and_there_is_strong_evidence_of_response_caused_deaths_in_the_most_elderly_and_in_young_males

If I was obliged to place a bet, I’d place it on ‘no pandemic’. Like all bets, it wouldn’t be certain. But if pressed, I have to say that that’s where the whole mass of the evidence seems to be pointing. I should say that I define a pandemic as being when a huge mass of people get desperately ill more or less all at the same time, and for a while the all-causes death rate shoots up hugely; then comes down again. On THAT definition: no, no pandemic.

There IS a nasty, somewhat flu-like illness about. Zach Bush insists it’s at least two different illnesses, one respiratory, one inflammation and blood-clotting based, not respiratory at all, and requiring distinctly different treatments. See the long vid of Zach’s which I linked to just below.

Both of these crises are triggered ultimately by gross pollution by violent, unnatural chemical pathogens in our environment, and by our resulting essential re-setting of our relationship with the ubiquitous ‘virome’, as Zach calls it, which is everywhere around and inside us, and with which we’ve lived in shifting - and essentially benign - balance for millions of years.

The overt illness which visits relatively unhealthy individuals as a result of this resetting process is - for a very small minority - horrible, dangerous, and even lethal. For most of us, not so much; for many nothing much at all. But clearly, being poor and living relatively deprived lives makes one’s prognosis with these crises a whole lot worse. Decent, sufficient living standards, plus the proven-effective treatments, make all the difference. As usual!

I should say that I now seem to have had two such nothingmuchatall encounters with one or other of these rough-water resettings - aka ‘illnesses’ - one last year, one just recently. Both times nothing to panic about, both extinguished within three days during which time I took - allegedly - huge doses of vit. C. Each time, the symptoms were milder even than a mild cold, requiring nothing much beyond taking it easy, and taking lots of C and D.

I go with that group of - clinically-blooded - doctors who published a group commentary on the covid thing just recently: “Really - nothing to worry about; nothing to fear”, as they kept insisting. Easily treated, and just NOT a mass death event.

With increasing certainty, it appears that the imposed responses to the scamdemic, particularly the poison-stabs, have been considerably more lethal, already; with more still to come. A huge crime against humanity, wilfully triggered by the crooks behind it.

2 Likes

Hi Everyman.
I think the Catte Black article is the kind of thing that might be used to address a crowd of supporters, as you’d know they didn’t need convincing, they just wanted encouragement and reassurance. I think it would go wrong when people started to cite these pronouncements to the wider public, they would be shot down by commentators as the usual crazy stuff from the extremists. There isn’t any evidence presented so they’d be wide open really. Overall I don’t like it as it doesn’t shoot from the strongest vantage points, rather warns supporters away from advancng them.

The Rancourt paper is interesting. I don’t think it’s that readable, the way it’s laid out has you paging down to read graphs, pondering the bottom scales with only every second YEAR shown then back up again to see what you are looking for, etc. Maybe they do that so as to keep the summary uncluttered.
In their initial overview they say excess deaths in Canada haven’t increased in 2020-21 beyond the trend. This is possible (I remember reading they didn’t increase in France). It’s a most interesting point, and you can only get it if you consider not only the five-year average, but the direction in which it seemed to be heading. A glance at Figre 2 shows this:
image

If you took the average of the previous five years in data that is increasing you give the impression of a sudden jump, because you’ve ignored the trend.

I wonder what @PP thinks of this!?

(There could be subtleties here. If a pandemic/epidemic starting in a country in March only killed people who were going to die in the next six months, you wouldn’t see an increase in excess deaths in the same calendar year, because they would have died anyway, that same year. I think he mentions somewhere the idea of counting from the middle of the year which would make a difference to this potential point).

Later in the paper he looks at age and province breakdowns, I’ve been looking at the age part and will post underneath.
Cheers

1 Like

@Everyman and TWIMC :slightly_smiling_face:

Rancourt (continued)

The pdf link to the paper is the easiest to navigate (and also allows you to paste text if you wish to): https://denisrancourt.ca/uploads_entries/1628290219153_Canada%20ACM%20into%202021%20-%20article----6dr_3.pdf

There’s not much stats at all other than the calculation of a trend, which can be more accurate than visual judgement.

ACM/w=all cause mortality by week. I think this focus is a good move, it gets us away from covid-this and covid-that, and also allows consideration of recent years individually rather than a crude average.

I think the main detail starts around PP 18-19. I’ve moved the graphs to amongst the accompanying text. I hope this slight rearrangement will be easier to read than the corresponding part of the paper.

My comments are in curly brackets {}.

Over to Rancourt:

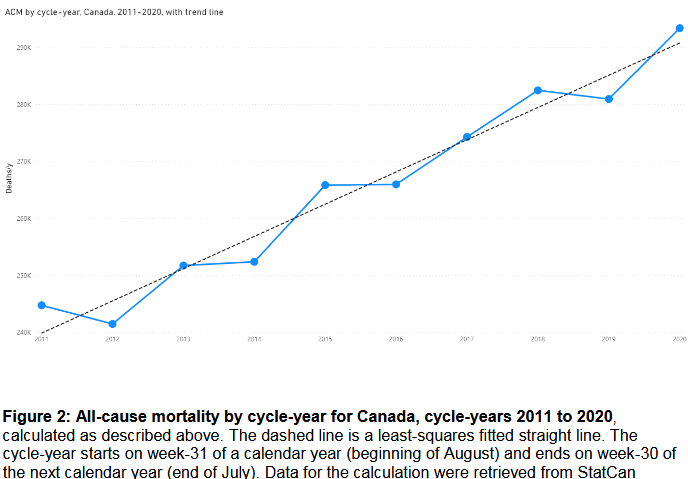
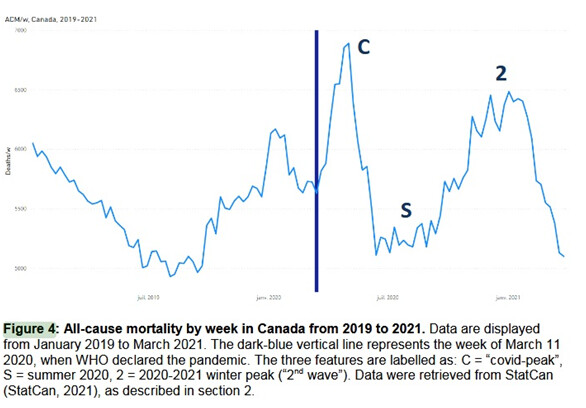
The Canada ACM/w feature “S” (Figure 4) is anomalous because its mean baseline

magnitude (5.25K deaths/w) is anomalously larger than the summer-2019 mean

baseline value (5.05K deaths/w), and significantly larger than the magnitude predicted

by the linear summer baseline trend values for the prior years, as can be ascertained

from Figure 1.

{Okay - it is larger than previous summers even accounting for the clear upward trend in Figure 1}

image

{Having established an anomaly, he examines it by age}

This means that some net 200 excess deaths per week were occurring in Canada in the

summer of 2020, in a season in which VRDs are not active. Below, we show that the

main contributor to these excess summer deaths was deaths of young (0-44 years)

males , an age where COVID-19 virtually does not cause deaths (Levin et al., 2020),

occurring predominantly in Alberta, Ontario and British Columbia. Whereas, the

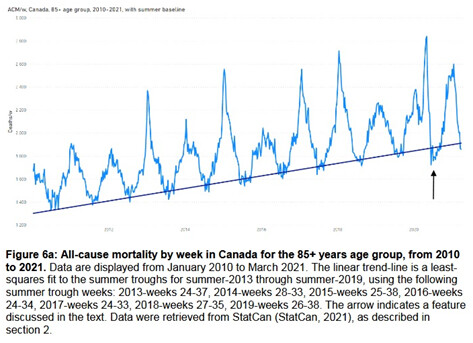
opposite occurs in Canada for the 85+ years age group: The summer-2020 mean

baseline magnitude (ACM/w) is significantly smaller than the 2010-2019 trend value for

this age group (Figure 6a).

{Yes, Figure 6a shows that this last statement is true}

{Jump to the 85+ age group :slightly_smiling_face:

image

Couldn’t this point about the lower than expected number of deaths in the 85+ age group in the summer just be that covid killed people from this group during the peak, thereby removing people in this age group who without covid would have died later, in the summer?

Maybe the point is just that the aforementioned summer rise (compared to the trend of previous years) could not be explained by covid deaths as these were predominantly in the 85+ age group in which deaths had fallen.

Except…that on P28 he asks specifically: "As such, the “S”-feature in the ACM/w of the 85+ years age group (Figure 6a) is equally anomalous. Why would 85+ year olds in Canada become relatively impervious to dying in the summer of 2020, in mid pandemic, between the presumed first and second waves of death? "

Has he considered the obvious possibility mentioned above, viz. that some had already died? He says next:

“Our interpretation is: The deaths of many 85+ year olds were artificially accelerated, at a time when seasonal VRD transmission is low, so that their deaths were not spread out into the following summer and fall, as would normally be the case.”

This is a little ambiguous. Does he just mean the big covid peak accelerated the 85+ deaths in the spring? That is the default explanation. Does he mean something darker - viz, the spring ‘acceleration’ was NOT due to seasonal VRD transmission? That’s possible but I don’t see how it would follow from the graph - the rise and fall in 85+ deaths might be clear, but does the explanation not lie outside the graphs?

Pending the penny dropping in my head perhaps, I think he’s on stronger ground with the 0-44 age group.}

{The 0-44 age group}

“Another large anomaly, which should be considered a national public health catastrophe of historic proportion but is virtually absent from the media and government-official pronouncements, is shown in Figure 6d, for the 0-44 years age group. Here, we see a significant increase in deaths, from a pre-COVID-period plateau value of approximately 260 deaths/w to a summer-2020 value of approximately 320 death/w, lasting at least 28 weeks, into the start of December 2020. The peak corresponds to approximately 2,000 excess deaths in this 0-44 years age group in Canada, following the WHO pronouncement of a pandemic”

(0-44 age group)
image

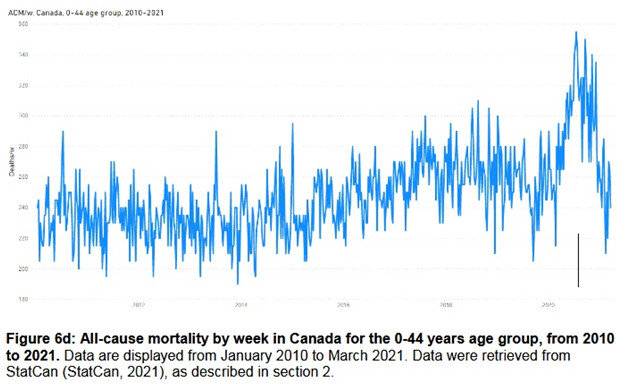
{The line I’ve added to Figure 6d is to mark the same position of the arrow as in Figure 6a, which there referred to the summer period. Rancourt refers to the average as 320 deaths per week. This is probably right - from the vertical scale the peaks read as higher than this, but don’t forget the troughs (due to this being weekly data) contribute to that average too.

He says the trend for that period is 260. We have to take this on trust (good luck in verifying this from the graph, where only alternate years are marked) but assuming this is correct, it does look like there are an excess 60 x 28 deaths, though 1680 is a better description than 2000.

He says there is a similar increase in the 45-64 age group (EDIT: albeit a smaller one). I’m prepared to take his word for that - if so it supports the contention.

This is interesting - what caused those deaths in younger males? But first the question has to be addressed whether the increase is real or just random. He does that by examining the increase further, by gender and then by province.
I’ve only glanced ahead to the gender part but I think the gist is that the increase in the 2020 death summer rates is actually down to male deaths. This strongly suggests that the increase isn’t a statistical blip, therefore requires explanation.

Cheers

1 Like

Thanks for going through the Rancourt paper Evvy! As you know, the ‘increase in mortality’ numbers for many countries are used to ridicule any people who question whether in fact the pandemic is artificial, phony, a creation of fraudulent PCR tests. So this type of study is quite important to understanding whether in fact Covid 19 is a new dangerous infectious disease.

However I find the paper quite confusing.

Another contention he has (he has repeated this contention in a paper about France) is that the beginning of the official pandemic announcement, the bold vertical purple line, in fact TRIGGERED the spike in mortality, because it triggered public health interventions, lockdowns, etc. I find this quite provocative, because the results were isolation of old people at retirement homes, who subsequently died in greater porportions ,‘from Covid’ or from isolation induced immunity reduction?

thanks, for your response, I hope to discuss thiis more.

E.

1 Like

Hi @Everyman

I have only had time for a quick look, so this is a bit of a “hot take” rather than a considered view. I would hazard a guess that the linear trend in mortality is related to the linear trend in population growth in Canada over the last decade. It’s hard to spot variations in the face of such a linear trend. I also found their averaging over a “cycle year” confusing. Averaging data from a very specific narrow time period over a whole year isn’t going to give a good picture of what was going on in that year, in my opinion. Also, if you are going to fit a linear trend like that, you should really take a look at the “residuals” of the data - how it deviates from the trend. This would have given some idea of whether the deviation from the trend is within (say) 95% of the normal or what have you. They didn’t seem to do any of this. Not sure why.

Going to the Stat Can website - the official data source of the paper - they have a useful graph that lines up the weekly mortality for the last 8 years (not the full decade). The picture tells a very different story:

Can you take a guess which year 2020 was? You can click the link above to see if your guess is correct. To be honest, these data are probably not normalised either, so I don’t really know what to make of them, but I think drawing the conclusion that

“We find that there is no extraordinary surge in yearly or seasonal mortality in Canada”

and therefore

"We conclude that a pandemic did not occur"

seems not to be supported by the paper.

I’ll have a better look when I have the time for it.

Cheers

It seems their point is that the surge was a result of the pandemic announcement, which immediately resulted in a change in public health policy, including isolation of retirement home inhabitants, which increased stress and thus decreased immunity and thus increased death attributable to respiratory disease. That’s how I read it, but I’m still trying to understand it.

thanks for your response,
E.

Hi PP. Good point about the residuals, there’s no stats in the paper.
They shouldn’t omit the zero on the vertical scale, it makes a 20 or 25% rise look like 100%. Similarly after the big peak, the 2020 curve stays above the others but only by about ten percent The two closest years are 2019 and 2018, indicating there’s a trend to be taken off that too when comparing the 2020 effect.
Assuming lockdown effects will have cost some lives, in my view only the big spike can be said to clearly qualify as pandemic material in Canada.

I think Rancourt makes some very good points to chew over; my reservation would be that in pushing his own position (‘There was no pandemic’) within the analysis, he makes it less useful. Eg he asserts that a viral pathogen could not cause such different effects in different provinces or countries. He does discuss the effects of reactive measures but without broadening the ‘research question’ or the definition of pandemic appropriately. You’re kind of left wondering whether to choose the message or the analysis. To be fair I haven’t got to the end…
Cheers

Yet again I’m mad impressed with our number crunchers, and will not be intervening in that aspect of the discussion :wink:

Three quick observations:

Catte Black’s article is a great piece of polemic, and the central point about resisting alternative framings is a good one. Not much more than that.

Secondly a minor point re the ‘dry tinder’ argument which was proferred in Sweden, for example. After a relatively mild winter pre-Covid, which might otherwise have seen average mortality but didn’t, a certain ‘oversupply’ of people on borrowed time (and please forgive my clumsy language) succumbed when Coroni came a-calling.

The corollary was seen in 1963 in the UK I believe, where Age Standardised Mortality Rates rose sharply. I was born in October 1962 and many many times have been told about the prolonged harsh weather in that winter. 90 days of snow cover sticks in my mind but in any case it was a harsh season and the ASMR reflected this. Another example was 1947.

Third point, a little facetious, is to reflect on the downfall of New York state Governor Cuomo. A driving force, with A.Fauci, behind the burning of the dry tinder, to continue my outrageous comparison, among frail elderly NY citizens? Pushed out of office due to sexual impropriety. Compare and contrast with M.Hancock…

This issue of the reaction to the “pandemic” rather than the pandemic itself being the cause of excess deaths was dealt with extensively on UK Column News over an extended period. They used offical figures only. If I had the time, I would trawl their back episodes and isolate just these but sadly that time is not available to me at the moment.

Morning @Everyman

I’ve heard this hypothesis a huge number of times, and I’m open to the idea that some of the deaths might have been caused in this way. It stretches my credulity to believe that all the excess mortality can be explained this way. And it seems pretty clear, contrary to the paper at the top of the thread, that there have been significant excess deaths in Canada.

So far I’ve seen multiple sources discussing covid diagnosis, treatment and deaths. I’ve heard multiple doctors around the world discussing how their hospitals are overflowing with covid patients, and how many of those patients were sent to care homes due to the pressure for beds in hospitals, and how subsequently, care homes exploded with covid. There is a strong evidence trail.

In all the discussions about how lockdowns increase the death toll, I’ve seen minimal actual evidence demonstrating this.

If isolation and stress caused some deaths then at the very least is like to see some kind of systematic study to show that. If isolation and stress caused all the deaths (i.e. there was no pandemic) then I’d need to see a significant body of investigative research to demonstrate that. There is good evidence, for example, that in the US suicides were very high over the last year. This would be the kind of thing that could be easily demonstrated.

Cheers
PP

1 Like

a quick note, I think the correlation between unemployment and mortality has been accepted by social scientists to the point where it can be considered a causation…has it not? And we know the lockdowns triggered mass unemployment and thus for those lucky enough to keep their job, in addition, mass fear of losing your job.

1 Like

Hi EM

Yes, you’re right, there is a strong connection between unemployment and many health metrics including mortality. I’m not sure what conclusion we can draw from that general statement in this specific instance, though.

In the US there is the added complication that becoming unemployed means you lose your health insurance and therefore can no longer go to hospital if you get sick, but that’s not true in Canada. And I’m not sure what kind of unemployment benefit kicked in in Canada over the last year. Here in the UK large numbers of my friends either worked from home or were furloughed. We’re waiting for the unemployment hammer to drop. Presumably that would mean another wave of deaths once the unemployment really kicks in…

Anyway. It’s a valid and interesting idea. It just needs to be backed up with an actually on the ground study to show whether it affected the mortality numbers in 2020 or not

Cheers

PS - it also wouldn’t affect the death toll in retirement homes as presumably the people in them are… Err… Retired? :wink:

Hi PP

What is all the excess mortality - we seem to be fighting the idea that there is this enormous stack of extra deaths, always bigger than any suggested other cause of death.
Maybe we can tie down some rough numerical estimates. Here is your graph again

image

The simple take home from Rancourt is that you need to look at the trend and not just the five-year average. He demonstrated a clear upward trend in deaths in Canada prior to the covid phenomenon. This makes the real deaths prediction for 2020 much bigger than the 5-year average, as every year it was increasing. Let’s call it 10% higher than 2019 (might be worth looking back to check).

I said above, after the covid peak dropped, the 2020 deaths were only 10% higher than the preceding year (which was 10% higher than the year before that).
I’ll amend that - the difference did rise higher than that towards the end of the year in the second handwave :slightly_smiling_face: Maybe to 20% higher. But remember the forecast was 10% higher, so that’s only 10% above forecast, and only during the covid peaks.
It looks higher from the false scale, which should show the zero.

What about that summer period when there was hardly any covid? Still looks like there were some excess deaths as the gap between 2020 and 2019 is the biggest. And remember our discussion about UK excess deaths? There were something like 600 excess non-covid deaths here a week throughout the so-called pandemic, including the summer period.

A point of neutrality :slight_smile:
Covid is the default explanation, anything else needs to be backed up by studies, that aren’t going to be done anytime soon.
Hm…what about a thought experiment - if we’d both just arrived back from Mars and hadn’t had 18 months of daily excess bombardment we could start with a hypothesis that there were multiple factors in these peaks on the graph, one of which was this new thing called covid. We’d no doubt quickly agree it did cause some deaths but without having been exposed to the bombardment we wouldn’t be pressured to nail it in as the default explanation, and the other factors (given that governments seemed to go a bid mad) would have equal privilege.
Cheers

Hi ED

I’ll try to get to the detail of what you say soon. For now

If I had just arrived on earth to the news that there had been a big spike in global mortality I’d want to know why. If I then learned that a novel coronavirus had swept through and literally hundreds of doctors around the world (maybe more) had all gone on record saying that their ICUs were full and hospitals had run out of beds, I’d know what the answer was.

There’s no mystery here…

Cheers

I TOLD you you shouldn’t have taken your Ipod :laughing: :laughing:

1 Like

Here is a study concerning excess mortality in Germany, very well argued, clearly shows that the mortality was normal, average, for all age groups. Well, I think that’s what it shows. I’ll let others decide for themselves.

Hi Everyman. I’m not so keen on this line of thinking as he seems to talk round the group with the most deaths, but here are my thoughts on it. I think deaths in an age group as a percentage of total deaths is a reshaping of the goalposts.

"After almost one and a half year of mass testing, can we not safely assume that the PCR test positives are a largely representative sample of the general population ?

Given that this is the case, don’t the deaths “with coronavirus” (i.e. with a positive PCR test) look as though they are part of the normal and unpreventable death pattern in Germany ? "

A bit but the 10% rise in the 80-89 age group also supports the idea that there are extra virus-related deaths. If not a blip it supports the latter hypothesis better than the former.

" Since the virus does nothing to neonates, children and adolescents – or perhaps because they have so far been submitted to fewer tests – people “with Corona” actually reach an average age which is a little higher than that of the rest of the population."

This is correct but as those in the group in question have mostly already reached it before they die, it doesn’t mean their death should be valued less.

" In statistical terms, the coronavirus (or – rather – the positive PCR test) is a random variable with regards to the result “death” – like athlete’s foot or wearing red socks"

That’s the conclusion the writer is angling for, but it probably doesn’t follow for the 80-89 group with its increase of 15% or so as a share of the deaths.

" On average however, the “corona deaths” would have left this world at the same time, with Corona or from (or with) another virus or another disease. We are not immortal. On average, we die at our average age of death."

Some (those dying ‘with corona’ but not ‘of corona’) would have died anyway, some but not all of those ‘of corona’ would have died the same year, looking the same in annual excess deaths but that would still be people dying before their time. Some of those who would have lived past the end of the year would have lived a lot longer.

I see this argument as masking what might be the writer’s real motivation, ie asking why should we make younger people suffer to save older people. It might not be his motivation but it would certainly appeal to those with that view, who get to argue it without revealing their real values.

" In every population, there are always a few 50-70 year olds who unfortunately die – this is inevitable in the human condition. Some of these 50-70 year-olds have always died of (or with) a viral respiratory infection (like the one caused by the Coronavirus). The essential question therefore is whether more people of these age groups die because of the Coronavirus than previously. The answer is No because:

  1. We have not observed and are not observing a significant excess mortality in these age groups.

  2. In percentage terms, the Corona mortality in these age groups is not only not higher, but effectively lower than the one in the general population. "

The “essential question” posed in the above paragraph is the correct one. but I think the conclusion is not right, because it was not the excess mortality in the age groups that was measured, just the deaths as a percentage of overall deaths. As a relative measure this is vulnerable to dominance by other groups with more deaths - like the 80-89, as indeed we have seen, which should overall make the relative percentage of deaths in the other age groups smaller and thereby make them appear smaller than they really are.

I say ‘not right’ rather than ‘wrong’ because it could be that the 50-70 group the true death rate did not increase, but that information is not given.

Even if the 50-70 death rate does turn out not to have increased we are left with the problem of the 80-89 group whose death rate likely increased. He doesn’t say much about that other than to include it in the claim that deaths didn’t really increase at all.

Cheers

2 Likes

Lol! :laughing:

The increase in death of the 80-90 cohort could also be a result of the response to the ‘pandemic’ rather than a result of Covid 19? That seems to be the case worldwide: when the WHO announced the pandemic immediately that triggered public health measures that were in many cases different from past years. The lockdowns forced elderly people inside with zero or very limited family visits. This isolation resulted surely in decreased immunity due to stress. Elderly people, we know for a fact, are motivated by contact with family members to stay healthy and keep living. We should just call it the power of love. And without love people die. I consider that a fact, which should be included in any mortality analysis.

E.

3 Likes