5 Filters

Dr John Campbell: Excess deaths in 2023

Hi @admin , from PM’s substack above:

" Very simply, we still don’t know what caused the (absolutely, definitely) real excess death patterns we have seen since Q2 2021. We have theories, and given that we are talking about hundreds of deaths a day, we urgently need to determine which of these theories is the right one (or, more likely, the right ones ) - only then will we have a hope to fix them. Current attempts to be timely on death registrations are doing this at the cost of mis-stating when these deaths actually happened. And this means we are likely to look to the wrong causes and address the wrong factors, muddying the waters, and making it less likely we will be able to address the issues themselves."

the bold script is mine - which to me suggests we have a real problem with excess deaths but now we have data that mistimes the deaths thereby muddying the waters - if one were to adopt a conspiratorial approach (like I do :grinning: ) then if date shifting makes it difficult to show that the jab coincides by time with excess death rates the PTB continue to laugh all the way to the bank.

I also note that the ONS continues to retain data or in some cases stops looking for it ( e.g.vaccinated versus unvaccinated by age) :
“The much more difficult issue comes when delays between occurrence date and registration date are not constant, but vary dramatically. There are a variety of ways of showing that this could be happening, but the most direct is to look at ONS’ monthly summaries of deaths by occurrence date (unfortunately, they do not release these weekly)”

I don’t entirely get this issue - if the timing of deaths are being pushed forward making current numbers too high, doesn’t this mean that earlier numbers were too low, it’s the ruck in the carpet argument - no matter where the ruck is its still there just in a different position, i.e. excess deaths are still there - which PM seems to be saying in the quote above.

cheers
1 Like

Hi @CJ1 Yes, the deaths are still there, but the correlation to the dates of jab rollout, out of new ages added to the jab, or the jab plus flu jab start are very muddied. Therefore correlation between deaths and jabs becomes much more difficult.

Ed Dowd has in one of his most recent reports, done a clear explanation of the delays (in the US) of reporting. However, they even allowed for the exclusion (due to late reporting) and they still ended up with such a massive correlation between jabs and excess deaths, that the conclusion can’t be doubted (IMHO).

1 Like

hi CJ

yep, PM believes that there is some amount of excess death. He may well be right. The big problem is that the registrations happen in waves where folks try to catch up on the backlog, then get swamped and slow down, then try and catch up again. This means that the deaths by registration is showing effects that are simply admin problems rather than actual patterns in deaths. Jean, on the other hand, seems to believe that there are no excess deaths to speak of, and 2023 is actually below what we might have expected.

At least that is the proposed theory.

According to this chap Jean, if you plot deaths by occurrence, things get smoothed out and it all looks much like normal. The problem here is that if we are seeing massive delays in registering, then deaths that are indeed occurring this year will not be fully in the system until the end of the year, or even next year now.

So, if this is what’s happening then it’s very hard to know just what the actual excess deaths are in England and Wales.

It’s all a big mess, as usual with the data.

1 Like

Hi folks, I assume that the 5 year average against which individual annual numbers are compared use the same method of compiling data - i.e. date of registration. If we move to date of actual death for later data then we can’t compare it to the 5 year average compiled on registration basis of data. ??

Why are most of the countries examined by Campbell the same as the UK - really high extra deaths? Are all the countries he covers making the same mistake and if so, how is this possible without some form of collusion?

Something doesn’t feel quite right here!

cheers

Probably. The 5 years pre-pandemic wouldn’t have the same pressure on registration though, so unlikely to have the same effects as this year/last year.

If we are seeing these massive waves of delay and catch up in terms of registration then we really can’t draw a lot of conclusions from the registration data. Plotting death by occurrence is a better way, but we won’t know the full story till next year now… Or whenever the actual deaths that happened this year are finally and completely logged.

A good question and worth investigation. As I said, I think this Jean chap has been looking at other countries too, and found that the excess deaths by actual date of death were not that worryingly over what would be expected… I hope he’s right, but we really need someone to check his numbers, add he’s just one voice among many right now.

Realizing the hazards of jumping in to a data analysis…

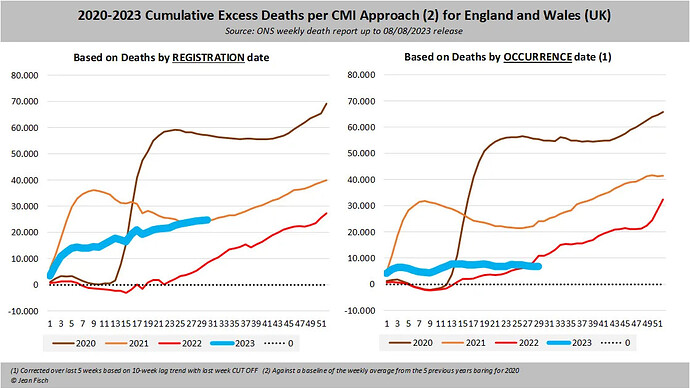
A quick look at Jean_Fisch’s graph cited by PM:

Fisch compares data by registration, then by occurrence. And points to the obvious difference in 2023 data, implying that it’s only the registration data that suggests the big excess mortality.
But might there not be delay in occurrence data as well, for 2023 - which isn’t finished yet?

Also of course, the two graphs both show the high excess deaths rising from mid-2021 and 2022! So it doesn’t jump out at me that this is a full explanation for the excess deaths pattern.

General thoughts on the new picture, as suggested by Jean Fisch:

I’m not sure of the scale of the alleged registration problem or the length of the claimed delays. I might need a bit of convincing that the delays are significant enough in number and length to cause the all cause mortality jumps.

Excess deaths data is a core purpose of the ONS data. I would find it a stretch to accept that all the countries simultaneously developed registration delays post covid, that were significant enough to have generated 10% or more excess mortality yet these delays didn’t surface except to explain away a huge problem.

In the absence of clear official information from the ONS it seems to have been left to people at the level of minnion or below (or no-one at all) to apologize for the state of the data - thus helping keeping the spotlight off it for a while longer.

The ONS should acknowledge that the official data seem to show a grave issue of excess mortality, and say what they are doing to correct it.

Meantime, why not just look at a longer period, rather than weekly or daily. For example mid-2021 to end-2022, or earlier if the data at end 2022 isn’t clean.
If indeed the excess deaths are present for the whole eighteen/twelve month period (compared to a period of the same length and seasonality before covid) then would that not establish that there is a serious problem?

Also supporting the excess deaths pattern (and a certain gene therapy medical hypothesis):
Denis Rancourt’s team related all cause mortality data of 17 Southern Hemisphere countries to vaccine and booster rollout dates.

The authorities could get to the bottom of a simple, key question - are the mRNA vaccines causing more deaths than have been admitted? - in a couple of months by a program of autopsies of deaths that occur soon after covid vaccination. This should have happened immediately the vaccines were rolled out and the Vaers reports data went through the roof.
In a sane jurisdiction this would be demanded at all stages, by everyone with responsibility.

It should not be accepted that the data is suddenly crap as an EXPLANATION, especially when the authorities have been avoiding collecting any evidence of vaccine harms.
Cheers

2 Likes

Yeah - as 2021 was high as well, the high 2022 can’t be explained by delays from 2021!

At some point the ruck will be trampled back to an acceptable time period, like Labour’s Corbyn era :confused:

2 Likes

Yes, I made the same point above. It could well be that we’re still counting 2023 deaths and r full picture isn’t in yet

There is some data showing the scale of the delays (up to 30 weeks as I recall). I think there was some discussion in PMs link above

Whether or not the delays are an explanation for the apparent excess deaths isn’t clear, but I thought it an interesting data point

Hi folks, I just had one of my tin foil hat thoughts -
if someone wanted to manipulate statistics on death and their time related causes wouldn’t it be a lot easier if deaths were calculated by registration date rather than actual date of death, after all a date of death is pretty hard to fudge and found clearly on all registers of deaths. Registration delays can be easily manipulated just by sacking or promoting a few key players when you need to, or setting up a new system or IT programme that takes weeks or months to bed in and then reverting to the old system when the new one fails!

just a thought :grinning:

Of course the current winner is the IDF which arranges for all the opposition to be completely data free by killing off the electricity and the journalists who can find the evidence. A bit like the ONS when they just don’t record certain information anymore because the numbers were getting embarassing!

cheers

2 Likes

@CJ1, Is it possible the dates of occurrence are only known once the death registration process has been completed? (Some system that would be! But it would explain the 2023 oddity highlighted by Jean_Fisch, ie that deaths by occurrence didn’t (it is claimed) seem to rise in 2023 ewven though they had risen in 2021 and 2022)

As Jean Fisch and supporter don’t seem to highlight the 2021 and 2022 data in their own suggestion (deaths by occurrence) I wonder if they they are ‘batting’ from a position of some emotional or personal involvement investment in avoiding an awful truth from gaining traction.
Of course for many with direct involvement or big vested interests, the idea that the mRNA vaccines have caused massive deaths may be ‘awful’ for preponderantly selfish reasons :wink:.

1 Like

Hi @Evvy_dense , you’re absolutely right bureacratic recognition of death only occurs after the death is registered which usually occurs when the next of kin need to access funds of the deceased to deal with burial costs etc, Banks always insist on death certificate or for larger sums Probate or Letters of Administration.

So yes registration first then the registrar will issue death certificates to show to various interested parties and forms to Social Services and the Revenue. But of course the date of registration is never important for all bureaucratic purposes - except for creating ONS data on death - the date of death is always on the death certificate alongside the date of registration of death my thought was why choose the latter to determine statistics on death, it’s not relevant unlike the date of death which can be crucial. Some Wills require beneficiaries to survive the deceased by a certain number of days before they can inherit so date of death can move tons of assets one way or another, registration date - nothing!

cheers

1 Like

Thanks @CJ1. Two interesting hypotheses. Offhand I’d have thought that it’s more likely someone slowing up the system than planning to benefit from the event that they want to conceal or manipulate itself causing system disruption to facilitate the concealment.
OTOH Norman’s Fenton demonstrated that even short delays can create false patterns of efficacy so it’s possible someone in the data-gathering system used this understanding.

Though it seems to me we still have good enough data to see excess mortality, just not for this year. I wonder how the 2022 excess mortality data looked last November.

I might be incompetent and miss the basics of the data, but actuarial statistics were the first to show the mortality. These guys don’t make billion-dollar stupid mistakes!

There’s also the rise in PIP claims (for disability) in the UK, posted here by @PatB

It’s hard to see imagine rises in disability not being accompanied by the proportionate amount of deaths.

Cheers

1 Like

thanks for this I was trying to recall it - I think he mentioned delays of just a week had impacts.

More stuff coming out - here from a whistleblower in NZ showing excess death rates far in excess of normal in many areas and in various jab lots. ( 30% compared to normal average 0.75% in the area analysis - using government data he actually administered!)

Also a comment under the Rumble video : " Phillipines launched investigation - excess deaths figures vary between 260k to 360k! (for year)"

cheers

1 Like

If I was looking for hard answers I’d be looking at actuarial research. I had a look in ResearchGate (and would recommend it, though Google Scholar would be a good place to look also). I may not be using the right sorts of keywords, but I think it is still too early to come up with firm conclusions.

Research ‘bubbles’ and the adverse impact of peer review and confirmation bias (and the like) would of course distort results but I simply don’t believe that researchers in this field would be shy about publicising firm evidence one way or another. If mortality tables needed adjustment, with knock-on effects on prices and thus profit margins of life insurance and pensions, most particularly, the potential for mitigating losses of huge sums would be a powerful incentive for researchers to keep beavering away.

I searched using the names of a few research-active actuaries that I know but couldn’t find anything. (Jaideep Oberoi, Doug Andrews, Pradip Tapadar, Paul Sweeting, and so on. Several of these have written standard text books. Paul drives an Aston Martin and didn’t get it by being inaccurate at difficult sums…)

I did find this for what it’s worth but, if you really want to get into the weeds, I’d recommend registering for these sorts of sites and setting up some keyword alerts:

A recent article:

https://www.researchgate.net/publication/375183400_View_of_COVID_vaccination_and_myocarditis_Is_it_real

Abstract says “more research is needed” - but that’s what they all say :wink:

2 Likes

We touched on this over a year ago in relation to the US and Indian insurance industries where they were reporting increases in premature deaths at 40% - but were sitting on a wealth of information and not blaming the jab. So, unless things have changed the actuaries inside the industry won’t be publicising this stuff anytime soon?!

cheers

Thanks @CJ1
This poor guy ‘Winston Smith’ is really suffering isn’t he, poor soul - and now having to assume responsibility for distributing the message.

It looks like there could be something big there. Though while this will have initial impact, I think they could have done with some data help before producing this video, which probably took over prematurely. I think they have run with an exploratory analysis - understandably so, as the data seemed to indicate an urgent problem.

They refer to averages from some sites and batches with high death rates without any other information that might partly explain the high death counts in these groups. The top site, with a death rate of 30%, was a care home. Against this, the average of 0.75% per year doesn’t make a comparison easier without knowing the ages.

Smith says the chances of the batches “not being a killer” are a billion to one, but that’s based on the national average. Opponents will slate this and say he’s just picked the top ones on a list, or the oldest age groups.

They list the top ten ‘vaccinators’; the death rates range from 10% to 24%. Seeing the bottom ones would be useful. Maybe none of them are below the average! That would make a very clear suggestion.

Overall statistics are needed, to relate to something tangible.

Clusters perhaps make a more robust pattern than the top vaccinators - a cluster here meaning a sequence of successive vaccinations where death resulted - but with conclusions limited to whether successive vaccinations are independent of each other, and with implications regarding individual batches.

In one of the sites (Invercargil, about 55m in) where there were 837 vaccinations there were 253 deaths, about 1 in 3 say.
Clusterwise, there were 3 occurrences of 11-20 deaths per day.

So - Is there a cluster effect separate from the apparent high death rate?

Well if one in three died during the period, the chance of a cluster of 11 starting from a random vaccinee (assuming the 1 death in 3 rate) would be roughly of the order of 1/3 to the power 11. About 1 in 50,000.
The chance of getting even one cluster of 11 among the 800 vaccinees would be about one in 50,000/800 or about one in 60. Two clusters, much less and the chance of getting three almost off the scale.
The film actually says in this site there were clusters of lengths 11-20. A cluster of 20 would be off the scale unlikely, even allowing for any cherry-picking among the sites.

So even if we took the death rate of 253 per 800 in this site as a basis (maybe they were centenarians :slight_smile: ) there would seem to be something else causing deaths of adjacent patients to be linked statistically. Cue forensics on batch issues.

For the majority of the public the overall high death count is a more telling take-home, if it can be established. I think they should have done something to indicate a problem irrespective of the distribution of deaths in particular groups.
Or as one btl said, just release the data.

Cheers

1 Like

Yes some difficult hurdles still there - the 120 daily analysis could fall flat if every other day not analysed were say 110 or 119!

I found the Kiwi presentation far too emotional, the presenter seemed to want to emphasise it.

cheers

1 Like

“I found the Kiwi presentation far too emotional, the presenter seemed to want to emphasise it.”

Yes I remember feeling slightly uncomfortable at this early on. I put it down to shock but it wouldn’t wear well with neutrals.

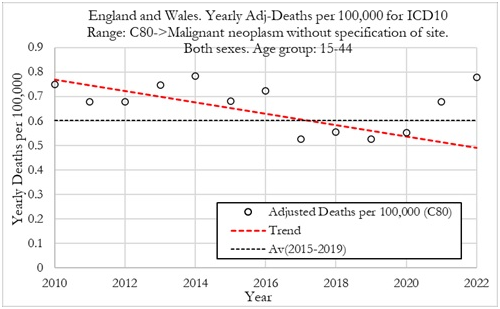
New Report: Young People Dying of Cancer at ‘Explosive’ Rates, UK Government Data Show

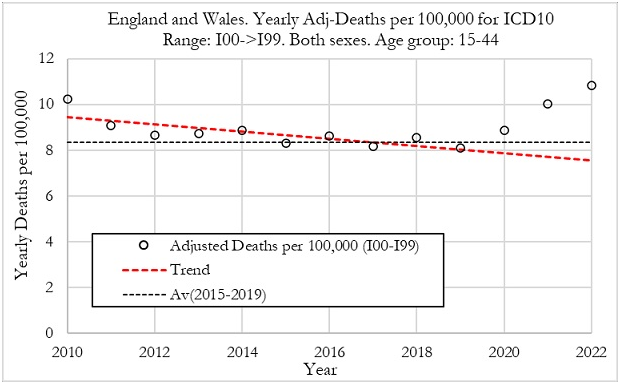
Edward Dowd’s group Phinancetechnologies has noted the discrepancy in excess deaths due to delays in registration, and adjusts the data accordingly.

They still note the freak rises in 2021 and 2022, focussing on the 15-44 age group.

image

There is a similar trend for cardiovascular diseases in the 15-44 age group, shown below,

image

ED

1 Like

Meanwhile back at the Kiwi presentation

Several big names have looked at this.
The data were sneaked out by a data adminstrator and has been doing the rounds for a while.
While the presentation is amateurish, the data provenance is the main obstacle to getting an endorsement by credible analysts. The data looks consistent with being the result of a few furtive grabs, hence incomplete, and there is no way of knowing what has been left behind.
The data are available for download in fact and many have done so.
Steve Kirsch has supported the authenticity of the claimed source. Norman Fenton (who I believe is recovering from surgery) has had his team do some tidying and has had a look, and said the data did seem to show a problem - but without endorsing the other analysis.

This is a far cry from full endorsement and much of the original data are missing.
Igor Chudov is sceptical despite seeing Fenton’s summary.

The best use is probably locally, for New Zealanders to use ‘the signal’ suggested by the incomplete data to push for the proper data set. After all it’s a small country that had very little covid to confuse matters, but so far decent data hasn’t been released.
But for vaccine campaigners pushing this outside of NZ, this is more likely to give ammunition to the vaccinators than headaches; there are much stronger and more robust cases to be made elsewhere using less questionable data.

1 Like