Hi Rich
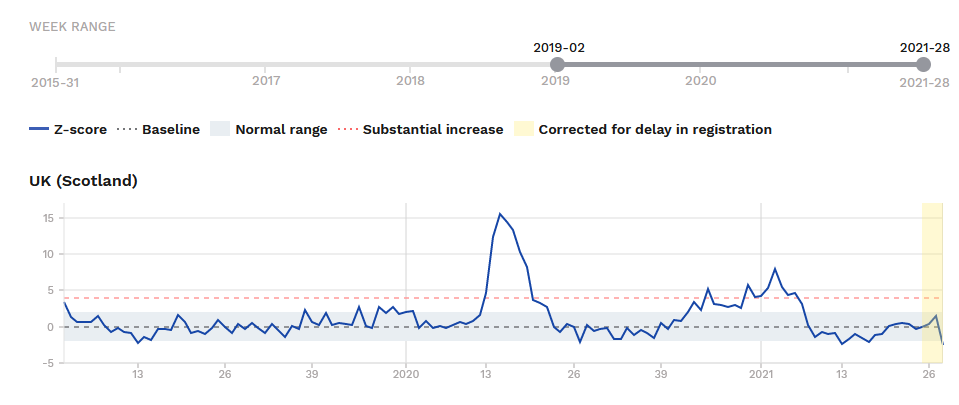
the problem that I have with such headlines is that we don’t really know the answer to the question is that more deaths or less than we would normally expect? Looking at the excess all-cause mortality chart for Scotland (see below) it seems to show that such a death rate is exactly what we would expect anyway. So what does that mean for the deadliness or otherwise of the vaccines? Don’t know…
Cheers
PP
![]()
It was a good question, apparently PHS have had loads of this request… The aim is to compare vaccine deaths and covid deaths on the same basis.
Deaths within 28 days of a positive covid-19 vaccine, 8 Dec to 11 Jun: 5,522
From the daily covid data:
Deaths within 28 days of a positive PCR, 8 Dec to 11 Jun: 3556.
Hi @Evvy_dense
Interesting, but it still doesn’t answer the question about excess deaths that I’m currently puzzling over.
Cheers
PP
EDIT: Also, do you have a link for the 3,556 number? Cheers! I found some data online.
You could say the same about the covid deaths. Many have.
A population level once-over is a cursory way to scrutinize events affecting a small subgoup of the population, because the effect that is of interest might be lost in the bigger population ‘noise’. So if the effect is not seen in the population it doesn’t mean the effect on the sub-population isn’t there. Kind of needle in a haystack?
In words, having a covid vaccine is associated with 50% more deaths than having a covid PCR diagnosis.
We need to reflect on that I guess - we don’t have the UK equivalent figure but why should it not be similar?
The covid figure is the reason why we are locked down, it’s why the population live in fear.
OK let’s think of the two Scottish populations being compared, for they are different.
The covid deaths are among the overall population.
The vaccine deaths (just using the same language) are among the vaccinated population.
Both populations lean towards the older.
The average ages might be useful.
One possible explanation:
The vaccine puts the elderly in more danger than covid - after all, they might not catch covid, but the vaccine rollout ensured they ‘catch’ the vaccine.
Not exactly. The excess deaths show up clearly in all charts covering the period. No excess deaths shpw up during the vaxx period.
As I understand it there is a deep confusion at the heart of the question. There is a baseline mortality, say X deaths. When covid hit, mortality exceeded the baseline X + Y. When covid receded we went back to baseline. There was a measurable effect - Y.
Compare that to vaccines. We are at baseline. We undertake a huge vaxx program. All cause deaths don’t exceed baseline to a measurable degree. No observable effect.
What conclusion, exactly, can we draw from that? My feeling is that it’s not cut and dried in any particular direction. More analysis is required.
This simple comparison doesn’t really show much in my opinion*
Cheers
PP
*Obvs constrained by my understanding!
This would show up over baseline mortality - it doesn’t seem to…
Do we take the EudraVigilance/ONS/VAERS deaths-shortly-after-injection as legitimate figures? Even the iffy government departments putting them out admit to this much. How reliable are they, even allowing that it’s generally thought that these official numbers are a smallish percentage of the realworld totals?
Whatever the nitty gritty about the intricate statistical speculations getting worked through here at 5F - usually ending with the baffled conclusion that we don’t really know the answers - those official, minimum, death figures seem at least moderately credible, since we can assume that they’ve been massaged down as far as possible.
Question specifically to P: Hi bro! Your experience amongst your far flung acquaintance, both here in Britain and wider afield, seems to turn up a lot of people suffering from something like a covid-flu, or indeed dead of it. What is it about your acquaintance that produces these - admittedly calamitous - numbers? I’m with just about everyone else whom I know: don’t know anyone - apart from Lifeboat Doctor dan - whose been desperately ill with it; don’t know - or know of - anyone who’s died of it. One of my nearest was diagnosed with it officially a week or so back, and her mum got a suspiciously-similar Summer flu at the same time - early July - and they are both well again now; within a few days in fact. Standard offing-flu experiences. Mind you, they’re both C-junkies, like me! 
Got any idea why you seem to be encountering so many genuinely bad cases? There must be some special reason, I suppose; but I can’t think what.
As to the wider question of a global excess death toll from covid: I have literally no idea how one would get a firm hold on that picture. Have there been millions of excess deaths? I don’t assume that it’s not possible, but wouldn’t know where to turn for figures that felt at all reliable. How do we get to know? I expect hindsight will allow us to get a better estimate, but how do we know now, with all the propaganda-scamming shenanigans that are going on, quite obviously?
I still have this hunch that the basic definition of a pandemic - a period when a lot of people get sick at once from some particular pathogen, and there’s a flood of excess deaths - just hasn’t been fulfilled. Globally, millions die every year; but our vision of how exactly always seems pretty blurred in the details; at any time, not just in this crisis. How do we tell with any confidence that there’s been a big jump in excess deaths globally? Official figures from obviously-questionable governments or the clearly highly-tarnished WHO? Really?
It gets very tempting to go for some firm position, on a hunch, but the strict truth is that I still see right now no cast-iron, fully watertight proof of ANY position.
Hi again, PP. Well I’m not sure of my understanding either.
Maybe we can slo-o-w down a bit… 
We’re talking about December to June for the vax period, let’s stick to that. So the same period for Covid. Ergo, the same excess deaths exist? Do you mean excess deaths that are actually covid deaths? (Or PCR-associated at least). Let’s have a ‘look’.
You can see these on the ONS graphs for England, remember these bar graphs with the covid in yellow and a dotted line showing the five-year average? Here’s the latest one (we’ll need to use England as a proxy).
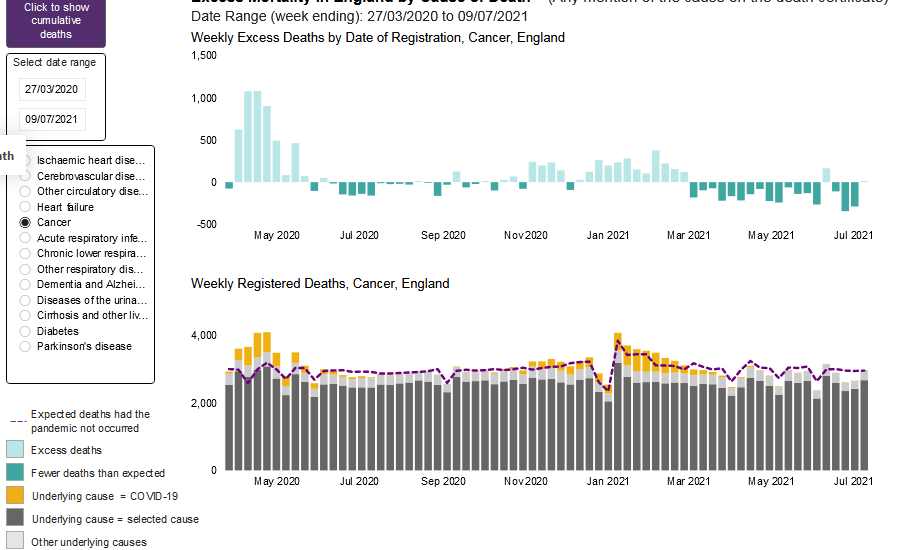
[Oddly enough the ONS graphs only give you that useful dotted line showing five-year average deaths when you select a treatment]
Just concentrating on the vaccine period…I have a some points:
-
For most of the treatments the excess deaths related to covid (ie the yellow above the dotted) isn’t all the covid. The covid ‘over-explains’ the excess deaths - because if it wasn’t for covid there would be a large unexplained drop in deaths. Therefore a portion of the covid deaths aren’t caused by covid. They would have died anyway.
-
The same would apply to the post-vaccine deaths if they were shown. However they are more numerous than covid deaths, so a smaller portion of those aren’t real.
-
The number of excess deaths may seem inadequate to explain covid-related deaths and vaccine-related deaths. However this can be explained if the vaccines are indeed reducing the covid deaths, even though they may be causing greater numbers of non-covid deaths.
Also there is an overlap between covid deaths and vaccine deaths because they are giving the vaccine to people without testing for covid.
Edit: So the covid total is boosted by getting all the deaths when there was covid and a vaccine.
Hi @RhisiartGwilym , on the VAERS system ( the US equivalent of the EU system for those who don’t know) the Defender had this to say a couple of days ago:
" As of July 9, reported deaths in the VAERS totaled 10,991. Of those, 4,593 occurred within 72-hours of vaccination.
The whistleblower — a computer programmer who developed more than 100 distinct healthcare fraud algorithms, and who has expertise in healthcare data analytics that allows her to access Medicare and Medicaid data obtained by the Centers for Medicare and Medicaid Systems (CMS) — filed a sworn statement under penalty of perjury alleging the actual number of COVID vaccine-related deaths is closer to 45,000.
The whistleblower alleged that VAERS, while extremely useful, is under-reported by a conservative factor of at least five.
In her statement, she said:
“On July 9, 2021, there were 9,048 deaths reported in VAERS. I verified these numbers by collating all of the data from VAERS myself, not relying on a third party to report them. In tandem, I queried data from CMS medical claims with regard to vaccines and patient deaths, and have assessed that the deaths occurring within 3 days of vaccination are higher than those reported in VAERS by a factor of at least 5. This would indicate the true number of vaccine-related deaths was at least 45,000. Put in perspective, the swine flu vaccine was taken off the market which only resulted in 53 deaths.”
cheers
Evening my good friend
Yes, it’s an interesting question. My suspicion is one of demographics. The folks I tend to be in contact with in the UK either live or work in crowded and poor urban areas (working in schools in South or East London, or living multi-generational households in Leicester - pretty common for my Pakistani relatives), and often in fairly crowded or multi-generational social housing. Most of them are not white people and are not well served by the current healthcare system. As Dr Dan (and others) have said, covid is disproportionately a disease of the poor and non-white communities. I know a fair few such people. The other category of folks I talk to are in crowded urban areas in sub-Saharan Africa - Accra, Dar-es-Salaam etc. with little or no healthcare, living on pretty piss-poor wages, poor nutrition and a general hard scrabble life. These are perfect fodder for something like covid. Even Havana -. Which had fairly good healthcare - is being hit pretty hard according to my friend who lives there.
Healthy, white folk living in suburban or even semi-rural areas in Europe are not seeing the extent of the trouble with their own eyes, I suspect.
That’s my hunch. Perhaps that’s not right, and it’s just coincidence. I remember having similar conversations back on the media lens board about the number of women that I know that have suffered sexual abuse. Perhaps it’s a demographic thing again, but way more than half the women I know have horrible and hair raising stories. Folks on the mlmb used to argue with me back then that they had never met a single woman who had had such troubles… Perhaps I just hang with the wrong crowd.
Cheers
PP
That makes sense. Poorer people are always going to cop the ills of society more than the privileged bourgeois - who are indeed my main circle of acquaintance; though with a hefty dose of proletariat acquaintance as well.
I’m aware, though, that even amongst the British white working class, who are my main proletarian acquaintance, they’re more likely to be amongst the global Pampered Twenty Percent, who make up the bulk of the population of Britain. It is true, though, that there is this little-perceived underclass of Brits - as you say, mostly of recent-immigrant background - who always seem to cop the shitty end of the stick, in employment and in life-style generally.
I suppose these folk will really be on the border between the PTP and the ADEP: the Abused and Deprived Eighty Percent, even when living in Britain. I imagine that even in this country, and certainly in the poorer regions of the world, those folk are always going to cop the worst outcomes generally. That makes sense. Poverty and deprivation are alway key drivers of life outcomes. I noticed earlier that your direct personal experience seemed to turn up more knowledge of people suffering from the covid thing than many of us seem to get. I guess this explains why.
Interesting too that, in the thread nearby, speaking about VAERS, etc. we seem to have complementary ways of working: you with analytical, rational investigation of basically mathematical patterns - ‘left-brain’ in the convention - whereas I lean naturally towards the intuitive gestalt-seeking ‘right-brain’ mode of truth seeking, being somewhat waywardly impatient with the nitty-gritty analytical work which you and Evvy do naturally. Ah well, I guess we’re all making our own contribution to the famous ‘blind men describing an elephant’ syndrome!  Cheers bro!
Hi @Evvy_dense
sorry for the tardy reply. I had to think through what you were saying, and then real life got in the way of a considered reply. Let’s have a go now and see if I’m way off base here.
This is an interesting observation for sure. I’m not sure that you can draw the conclusion that therefore covid deaths are inflated, however. It could be, for example, that certain other causes of death in regular years were affected by the restrictions that people lived under last year. Behavioural changes, for example, might well have caused a reduction in normal baseline mortality. Wearing masks and social distancing seems to have wiped out the 'flu, for example. Far fewer people commuted last year than previously is another example. It would require some pretty detailed work to disentangle the effects of the various lockdowns and other restrictions on mortality, but I don’t think we can go straight to “a portion of covid deaths aren’t caused by covid” from this data. I know that there are folks who believe that the lockdown actually caused a large number of deaths, but I have yet to see any evidence of that.
Jumping to you other post:
Let’s agree that there could be a combination of covid deaths and vaccine deaths represented in the data for excess mortality this year. Here are a few of my thoughts about the distribution between the two possible causes.
The peak excess deaths (from your chart, not the Scottish one) look to be in February 2021. How was the vaccine rollout going at that time?
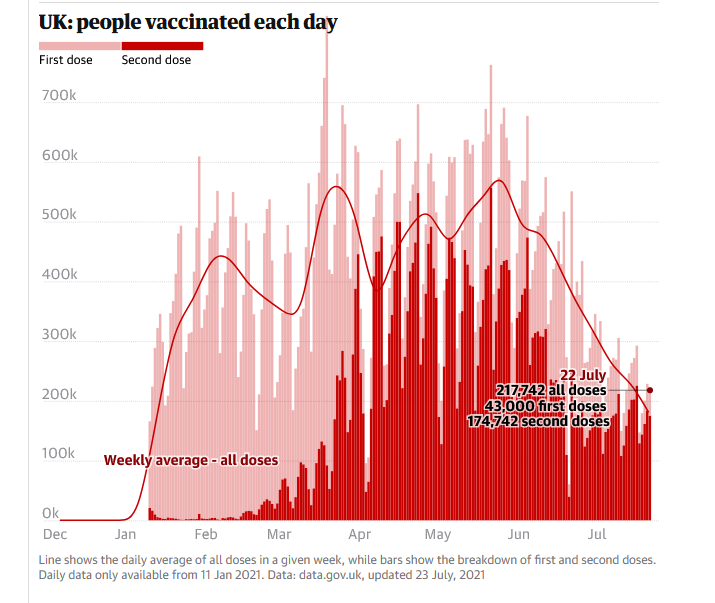
Somewhere in the region of perhaps 2-3 million people had been given a single dose of (mainly) the AZ vaccine. Almost no one had 2 doses (there was a 12 week wait in between). In other words, we were right at the very beginning of the vaccine rollout program.
It doesn’t seem plausible to me that we had a big spike in mortality due to vaccines with a small number (2 million) of single jabs right at the beginning of the rollout, but as the rollout increased to multiple 10s of millions of double jabs, the excess mortality drops away to zero. We would expect vaccine related deaths to increase as the number of jabs (especially double) increased. We see the opposite.
Unlike the vaccine numbers, the numbers of covid hospitalisations from the winter wave does match pretty closely with the chart you have above. As did the previous waves when there were no vaccines being offered.
My feeling is that both those things together tell me that the vast majority of deaths in the Spring of 2021 had to be covid deaths and not vaccine deaths.
Finally,
Yes, this is a good point. It could well be that the high numbers of deaths last year shifted the average upwards, leaving us in negative territory now. However, the whole point of this thread is that on the face of it, it looks like there have been more deaths related to the vaccine than there were with covid - 5500 vs 3500. If we are to believe that the early days of the vaccine rollout produced a big spike in mortality, and that this continued to grow as the vaccine rollout continued, then we should expect to see a large number of excess deaths being recorded as the rollout picked up steam. April/ May and perhaps June of this year should have been the peak of those deaths. Instead we see excess mortality dropping for the first half of that period, and picking up very slightly as we move into the second half of that period.
Could it be that vaccine deaths are pushing that number up very slightly? Definitely. Could it be that other factors (relaxations in lockdowns and behaviour) are returning the baseline mortality to something more normal, also definitely yes. Could it be that the Delta variant of covid has started killing a few more people? Also possible. Which one is the main driver? It’s not an easy question to answer in the end.
This post got a bit long and rambly in the end. Let me try and summarise it. There could have been a number of deaths as a result of the vaccine rollout. I’m not saying that this could not be the case. However, I still see no actual evidence from any data that I can find that this is actually the case. The data seems to show a reduction in mortality as the vaccine rollout picked up steam.
If so, then how do we explain the 5500 vs 3500 number that you highlighted? I don’t know for sure, but my hunch is that the 5500 are almost totally a subset of the baseline mortality and therefore exactly what we would expect in any case, while the 3500 were over and above baseline and caused by a dangerous virus that is swarming around the country. It has been said over and over that as you vaccinate a large number of people, some of those people are going to die. That doesn’t mean it was the vaccine that did for 'em.
These are complex questions, and take time and effort to answer. I guess that’s my main point in all this.
Ok. That’s enough typing. If I have missed your point (as I have done in the past!) I apologise. But let me know. Hopefully there is something interesting for you to chew on in this post regardless.
Cheers
PP
Hi @PontiusPrimate , one point - right from the start, age and comorbidities were the key factors leading to death or serious illness “from/with” covid - so the jab side effects (including death) could very well follow the same pattern. Haven’t the jabs been rolled out to the “vulnerable” and the elderly first and gradually dropped down the age cohorts over the national distribution of jabs - wouldn’t this therefore lead to smaller jab victims as time goes on. But the closer you get to the youth the closer you get to zero covid virus risk making it easier to say the jab is more dangerous than the virus?
cheers
Yes, a fair point @CJ1. We didn’t get all the vulnerable by February, though, so we should still have seen an increase in mortality.
But perhaps not. Perhaps there was a spike in vaccine deaths for the vulnerable in February. This is a hypothesis that absolutely needs to be investigated. It’s a complex thing to tease out.
Would that mean that the risk of dying from the vaccine had now gone away, in the case? It’s been a few months since we started the rollout now…
even then will anyone be able to unravel the numbers and the causal links so far down the chain - doubtful.
I still adopt the following
- the virus is almost 99% risk free for most people
- the jab clearly doesn’t stop you getting covid or passing it on
- all the risks from the jab have not been properly examined
- taking D and C regularly and ivermectin and zinc if seriously affected
cheers
Hi CJ
Can’t argue with any of that - all very well said. Although I would say that the chance of surviving covid is 99% for most people. There is still long covid, and serious illness to worry about.
I’m still trying to get to the bottom of headlines proclaiming 10s of thousands of deaths from the vaccine.
Cheers
Hi PP. Thanks for your considered reply.
Ramblin’ posts, ramblin’ posts. Where they take us, no-one knows…
Mad distractions, stats and ghosts. But my body’s no vaccine host.
(Nat King Cole, not quite. )
I’ll probably answer in two parts if that’s OK as I wish to defend my key point, and it might be useful to reach agreement at least on where we stand on it.
“This is an interesting observation for sure. I’m not sure that you can draw the conclusion that therefore covid deaths are inflated, however. It could be, for example, that certain other causes of death in regular years were affected by the restrictions that people lived under last year. Behavioural changes, for example, might well have caused a reduction in normal baseline mortality. Wearing masks and social distancing seems to have wiped out the 'flu, for example. Far fewer people commuted last year than previously is another example. It would require some pretty detailed work to disentangle the effects of the various lockdowns and other restrictions on mortality, but I don’t think we can go straight to “a portion of covid deaths aren’t caused by covid” from this data. I know that there are folks who believe that the lockdown actually caused a large number of deaths, but I have yet to see any evidence of that.”
This is a clear point of disagreement as I think you can draw that inference that covid deaths in the second wave are inflated.
My point is that if covid played a role in these deaths then it follows that if there was no covid the people wouldn’t have died. But the presence of yellow ‘covid’ deaths under the dotted line show that if all the covid (yellow) were removed there would be an unexplained, significant drop in deaths. Therefore in this scenario, too many of the yellow deaths have been removed and so those in question - below the dotted line - should not be counted as covid deaths.
Doesn’t your alternative explanation - that restrictions or behavioural changes affected the deaths - still refer to a class of deaths that would not exist had there been no covid?
So I have to stick to this claim. I first put this to the board at least a couple of months ago no it’s not a new rush of blood! I’ve thought about it a lot - if I’m wrong somebody will have to show me my blind spot. To repeat, it is that it can be inferred from the graphs that covid deaths after November/December are inflated
But there are several other unusual factors that support this explanation, and if my explanation is wrong they therefore require another explanation.
-
The covid deaths in last years’ peak are all above the dotted line, the five-year average.
-
Further, in this period in the UK they were only testing people who were actually ill (unlike the second wave where there must necessarily be far more positive tests from people who HAD covid previously). That sets up two scenarios, one where covid is not over counted and one where it is. The unusual position of the dotted line during the second wave is compelling confirmation.
There is a further factor. Just to incorporate a point you make later:
“I know that there are folks who believe that the lockdown actually caused a large number of deaths, but I have yet to see any evidence of that.”
More precisely, is your point that there must be some, but data haven’t been gathered?
Nevertheless I think there is clear evidence of non-covid deaths from covid policy. There is more in these ONS graphs, which leads to my third factor:
- The graphs have consistently shown there is a high number of excess deaths at home - averaging about 600-700 per week. To verify this you need to go to the link and click through the pages to page 9. This shows deaths by place of death. Then you have to select ‘Home’. You then get this graph:
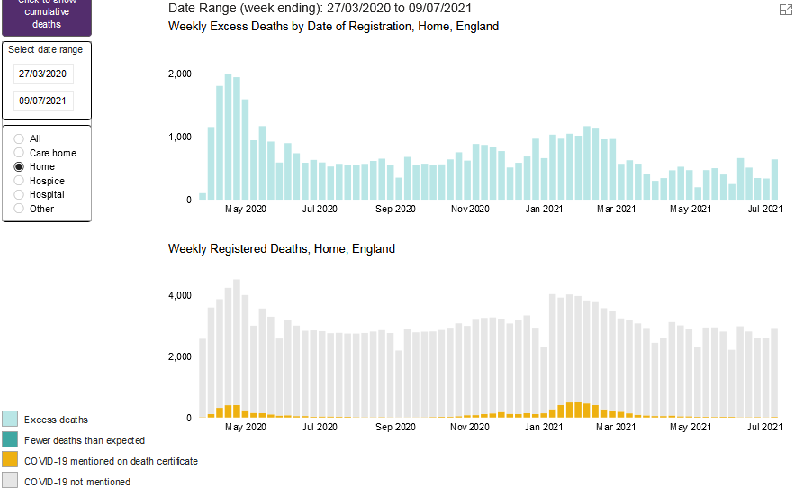
(Edit: referring to upper graph, weekly excess deaths at home. Also the right graph now showing, soz).
This is a lot of deaths over a year. It falls a bit after March this year but totals more than 30,000 deaths. The apparent fall from March will have been affected by the onset of covid last year.
Crucially, these excess home deaths aren’t covid deaths! You can see that from the fact they continued unabated from July to October when the lower graph shows there was hardly any covid.
Nor were they counted as covid deaths. But they must be related to covid in some way. If not lockdown, then delayed hospital treatments. For my point, it doesn’t matter which. There are plenty of deaths not from covid, but from effects of covid on policy or people’s behaviour.
In summary (of this key point) when you include misattributed covid deaths and also home deaths (which evidently aren’t due to covid) this is a big chunk of the excess deaths in the second wave.
This means that there is plenty of room for a number of vaccine deaths that rivals or actually exceeds the number of covid deaths, which themselves, I argue, are inflated in the second wave.
(I should say that although I say the covid deaths were counted ‘correctly’ in the first wave I only mean this was correct as far as the admin and covid defintions in use were concerned. In my view the second wave shows up the bricked-in flaws in this counting process)
Cheers
ED
Fascinating to lurk on this thread!
I used to work in one of the few academic schools of Actuarial Science and got to know a fair few of the academics (many statisticians also). Although I’ve changed job and downshifted to part-time I hope to be catching up with some of them in the coming weeks. (At least we now, since July 19, don’t have to fill in a form asking for permission to come to work. I’m not even joking.) One of my tasks was web author in fact https://www.kent.ac.uk/mathematics-statistics-actuarial-science
Until I can offer any juicy goss from that direction, the number crunchers may find these reports of interest. Actuaries tend to have a bloody good grasp of numbers and their livelihoods depend on grasping the realities of risk/mortality. Not a phrase I recall using in the web pages lol.