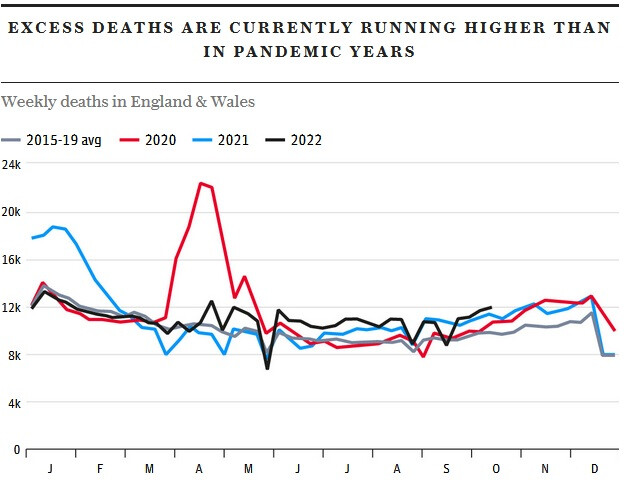
A revisited topic - discussed hear a year ago amidst much uncertainty - rearing its ugly head again, with less uncertainty. A year ago the question was could the graphs be hiding excess vaccine deaths? Covid deaths were another complication.
But now there are certainly a shedload of excess deaths (the gap between the current (in black) deaths and the level expected (grey line)), and which are not explainable by the small number of covid deaths.
A look at the left hand scale shows these are alarming numbers, well over a thousand extra deaths per week.
Also worth noting is that contrary to the T’s implication, this gap between actual deaths and expected deaths has existed since about April…2021.
Yet one explanation you will not see discussed in this Telegraph article is the covid vaccines.
These are safe by definition.
ED
4/11/22 Crisis as excess deaths soar to levels higher than during Covid pandemic
Collateral damage from hospitals cancelling and delaying treatment to focus on coronavirus blamed for mortality rate rise
By Sarah Knapton, Science Editor 1 November 2022 • 5:59pm
Excess deaths in England and Wales are currently running higher than in the main pandemic years of 2020 and 2021, figures have shown.
Throughout October, there have been an average of 1,564 extra deaths per week, compared with a weekly average of just 315 in 2020 and 1,322 in 2021.
Latest figures from the Office for National Statistics (ONS) showed that in the week ending Oct 21, there were 1,714 excess deaths in England and Wales, of which only 469 were due to Covid - just 27 per cent of the total.
It is 16.8 per cent higher than normal. Deaths are also running higher than the five-year pre-Covid October average from 2015 to 2019, figures showed.

Health experts have warned that some of the unexplained deaths are being caused by collateral damage from the pandemic, when operations and treatments were cancelled or delayed as the health service concentrated on Covid.
The Government’s “stay at home, protect the NHS” message also left many people who needed medical treatment unwilling to bother the health service, or afraid they would catch coronavirus if they went into hospital.
The NHS is also struggling from long-term staffing issues and current shortages because of coronavirus, leading to record waits for ambulances, treatment and surgery.
Dr Charles Levinson, of the private GP service DoctorCall, which has seen a rise in patients presenting with advanced conditions, said: “What is driving the excess death crisis? In my view, delays in diagnosis/treatment now and throughout the pandemic.
“The reasons behind this are clearly up for debate. I also believe that the Government needs to be far more open on this and tell us what they are doing to solve it.”
Excess deaths are stubbornly high and show no sign of slowing, despite a fall in coronavirus cases.
Data from the Institute of Faculty of Actuaries Continuous Mortality Investigation (CMI), which takes into account the ageing population, is also showing significant increases in excess deaths.
The CMI found that there were 13 per cent more deaths this week than if death rates were the same as 2019.
“That’s another significant excess,” said a spokesman. “Calculated excess deaths were significantly higher than the number of deaths mentioning Covid on the death certificate. This continues the pattern of recent months.
“Cumulative mortality rates year to date are 3.3 per cent of a full year’s mortality worse than 2019.”
*The new data follow analysis from The Telegraph that showed that in the past six months, there have been more excess deaths from causes other than Covid than deaths due to coronavirus for the entire year.
There have been 18,734 deaths due to Covid this year, but since May there were 24,440 deaths where the primary cause was another condition.
Over the past six months, non-Covid excess deaths have been running at three times the rate of Covid deaths.
Some of those people did die with a coronavirus infection, but it was not the main reason for the death.
Covid death registrations published by the ONS have been creeping up in the past few weeks, following a rise in coronavirus cases in the middle of September. However, the government dashboard is now showing a drop in deaths.
While ONS figures only run to Oct 21, the dashboard figures are updated up to Oct 27 and show a drop in Covid deaths in England of 10 per cent over the previous week.


