5 Filters

Influenza disappears from planet

I don’t know about anyone else but the drive in the media this week to terrify everyone into a second lockdown and god knows what else reminds me very much of the media campaign that led up to the Iraq war. Obviously the twenty odd thousand ‘cases’ per day weren’t having the relevant effect on peoples psyches so we had 100,000 a day from the sodding Imperial College, 50,000 a day from the ONS, half a million a week, again from the ONS and today SAGE are saying that their worst case scenarios will be exceeded. All this of course is accompanied by ‘human interest’ stories with titles like ‘We feel unsafe when shoppers don’t wear masks’, ‘Am I allowed to hug my friends now?’, ‘Covid-19 : We need a circuit breaker’ and ‘Is a national blanket lockdown inevitable?’. However the Chris Morris award for most blatant propaganda goes, today, to the BBC’s Clive Myrie and his video which is linked from the BBC News main page under the title ‘This Pandemic is instant death’ -

Have a quick watch…

Meanwhile, in the ‘real’ world, I still don’t directly know anyone who has died from it. I’ve worked throughout this year and many of my gardening customers are elderly people. Not one has died. Not one has had ‘it’. Not one has related how friends have died. Now, full disclosure, a customer’s husband, a man in his late 70’s in late stage dementia who was transferred to a home a couple of months before he died, by his daughters account, caught it and died. She also caught it. She is fine. I’ve largely gone about my day, shopping, walking around, visiting my Mum, hugging my Mum, seeing my Brother, hugging my brother. No one has had it or knows anyone that has had it, let alone died.

Anyway, all this is leading up a chart I saw from the W.H.O. regarding global instances of flu, posted on the 23rd of this month.

Here it is

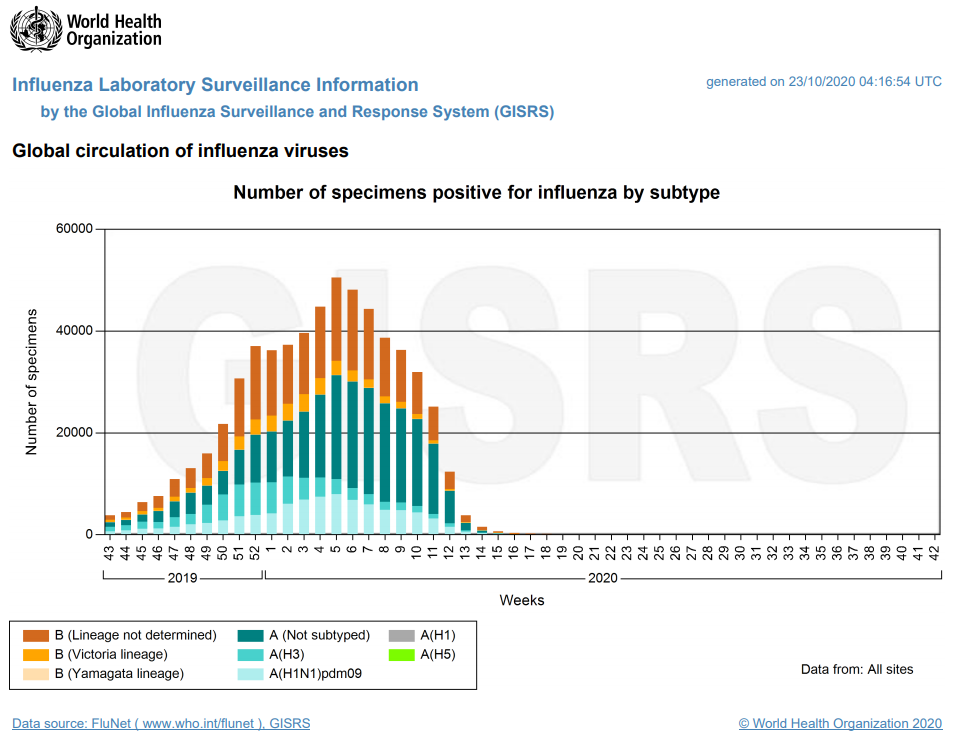
So, as you can see, flu is gone, presumably scared off by the awesome threat of COVID-19

Or…

Everything is being lumped into the Covid figures; cases, hospitalisations, ICU, deaths. Because it can’t be the case that flu is gone. I don’t trust the figures as it, but whatever they are (and I accept that there is something called SARS-CoV-2) this chart and the abscence of any flu has to be significant. The fact is, if people stopped to think about it, this massive inflation of cases (500,000 a week for example) works against the idea that the fatality of the disease is anything out of the ordinary, given that deaths are in the low hundreds and further given that the certification of deaths with/from Covid is a unknowable and highly problematic variable. But the headlines are what is important.

We’re being played people.

A final note.

I’m from Luton and follow the local team. Our main striker had to miss a couple of games because he tested positive for Covid. In any serious world that would mean he HAS IT. Right? And even a mild cold would make you feel a bit shitty for a good few days.

Here he is, about half way through his ordeal

No sense from the comments that he’s been ill or felt under the weather. No, just keeping fit until he can return having not been ill in any way. Which he did.

We’re being played people

As always, I stand to be corrected on my conclusions and inferences. I’m not a doctor, a physician, an epidemiologist or a virologist. However, it doesn’t feel right and never has, just as the lead up to the Iraq war didn’t. I’ll link again to a highly relevant video that may have been missed by some as I think it outlines what may be really going on.

2 Likes

So I just listened to Ivor Cummings latest YT video and it seems that when another, new, virus is making its way through a population, other viruses are less prevalent. Just thought I’d update my previous post.

Here’s the video

Pair of useful terror-miasma-dispersing videos, spike. Thanks. Emphatically, your instinct is right: there’s something obviously wrong, deceitful, full of unadmitted - and pretty certainly criminal - agenda going on with the covid hyper-panic scam. As well as there being - as no-one is disputing if they have any savvy at all - a rather unusually nasty flu virus doing the rounds just now too; as it progresses - as usual - on its way to the usual immunity balance sometime pretty soon; maybe already.

Cheers from your reeeeeecklessly unmasked and undistanced neighourhood troublemaker, RhG! Hwyl!! :slight_smile:

PS: Just girded loins and also looked at that beeb report. I had forgotten just how nakedly dishonest the beeb managers are these days. 'Course it doesn’t help when they have a willing Uncle Tom doing their deceit work for them in hushed, subdued tones; using virtually 100% pure tear-jerkery rather than facts. (Side-bar: are Anglo-Brit mediawhores ALL failed would-be actors, who went into mediawhoring because it pays better and guarantees more regular work - at least to all those who can pass through the Five Filters, like a covid virus through a mask?)

A few actually-relevant facts did seep past the editors, though. Like the fact that the Navajo nation are amongst the most socio-economically disadvantaged people in NAmerica; and such poor people always get hit worst by whatever’s slaughtering us. Though of course that well-attested reality is always, always carefully glossed over in silence. As here.

Thanks Spike. Interesting indeed that graph about the vanishing flu. As you say, the whole covid crisis feels wrong and the more one looks at it, the less sense it makes. And like the Iraq war, the reasons keep changing. First the lockdown was to prevent the NHS from being overwhelmed. But they’ve had months to get the right number of beds/nurses/ventilators etc. so there should not be any need for a lockdown. So for some inexplicable reason they decided not to get the NHS into shape (just on this issue) but instead prefer to shoot down the economy and destroy the social fabric of our society. One has to ask: why?

I’m always puzzled how many, otherwise intelligent, people don’t want to consider this. Alex Krainer (thanks for putting that videoclip here) at least gives an explanation what is happening and why. The fact that the World Bank has lockdown/curfew conditions attached to their loans (eg to Belarus – which Lukashenko refused) should make us very suspicious.

Hi Spike

so my next door neighbour’s sister caught Covid and died. My neighbour couldn’t take her children to the funeral. One of my friends dad caught Covid and died. He couldn’t go to the hospital to see him. A friend of mine works in a school in London. One of her co-workers caught covid and took it home. Three of her family died (they were non-white and many lived together in a single house).

That’s 5 people connected directly to my fairly small circle who seem to have caught covid and died. I don’t know one single person in my whole entire life who died of the flu. Of course this is all anecdotal, and you don’t know me so have no reason to trust what I’m saying… but that is my current reality.

On the subject of disappearing flu, unless I’ve missed something, I’m not that surprised. As far as I know:

  • Flu has an R0 of something 1.3, and a mortality of 0.05-0.2%
  • the 'rona has an R0 or 3.5 - 6 depending on the study you look at. It has a mortality of (probably) 0.3-0.9 depending on which papers you look at.

If social distancing and lockdowns worked to drop the 'rona down from R0 of 3.5 to (lets say) 0.8 that means it reduced transmission by over 75%. If those same measures affected the flu in a similar way - even if they only reduced the flu transmission by 30% instead of the full 75% - that easily brings the R0 for the flu below 0.8, meaning that it will exponentially die out and disappear. Driving down SC2 is a much harder task than driving down the flu transmission. Also the number of people travelling around from country to country seems to have massively dropped, stopping a route of global flu transmission.

That logic seems pretty reasonable to me… Have I missed something obvious here? Happy to be corrected, as always.

Apart from that, thinking about what might be your main point. Yes, we are getting played. The narrative that the only possible thing to do is lockdown or not lockdown is a false one. Lockdowns are nowhere near as effective as universal mask wearing and a functioning test, trace and isolate scheme. And the TTI schemes are waaay less intrusive and damaging to society. It needs a strong local govt, and local teams of people employed to make this work though. And support for the least well off if they need to isolate and lose income for a few weeks. Plus you don’t get to enrich your millionaire friends by building apps that steal people’s data… so not interesting to our government then.

That kind of scheme, together with free vitamin D and early use HCQ plus other treatments would completely turn this pandemic around in the course of a few weeks. It’s been done already all over the world. We should do it here.

cheers

1 Like

Hi PP, I won’t dispute your experience and I’m sorry for the people who have died. I’ve been aware throughout all this that if, say, my Mum had caught it and died, my outlook would probably be very different. Having posted about the disappearance of Flu I’ve read further on this phenomena, including Dans retorts to Willems post on TLLB and am prepared to accept that I’ve drawn the wrong inference from the WHO chart, largely for the reasons you describe. I still hold that, given the endemic state of the virus in the uk, something like the Barrington Declaration is the only viable course for humanity as a whole. It will be argued that this is a sociopathic point of view but I disagree. A virus that has the characteristics of Covid, largely affecting people at the end of their lives is just one of those things we will have to learn to live with, like cancer. The alternative, a regimented, digitally tracked society terrified of itself and subject to the whims of the governing power is an infinitely worse prospect

2 Likes

Hi Spike. I wouldn’t be too quick to dismiss your instinct that the near-disappearance of the flu - even if only for a year pr two maybe - is a very big deal. Eg we’re going into damaging lockdowns to stop Covid from replacing the flu as the annual big threat to the elderly. That really needs a substantial new debate. The hostile comments on the other site reflect entrenched thinking and existing personal history.

Good points PP, clearly there are considerable variations in individual experiences! Also depending where you live, or where people you know work.
The peak of the flu data, week 5, was around the start of Feb. The UK lockdown was around week 12, by which time the world flu figures had been falling for 7 weeks. France lockdown began March 17, Italy 9 March (in week 10) I think Spain was similar. If these were UK figures they wouldn’t be explained by lockdown.
Asia of course was first affected by Covid though, and the first drops in flu figures might have been caused by their anti-Covid measures. I’d really like to see clear UK and Europe flu figures and also flu figures maybe by continent.
Cheers

1 Like

Thanks @spike and @Evvy_dense. I appreciate both of your comments. One more point on the lived experience thing - my mum is 84 with all kinds of health issues. She lives alone in a little bungalow. I on the other hand am not aware of any particular underlying health concerns (high blood pressure when I see a Tory maybe) and so I’m free to more or less do as I please. My biggest worry though is catching the rona asymptomatically and then passing it to my mum. I don’t see how the Barrington biz will help that. It seems to me that nothing short of proper test and trace will help that.

Back on the flu issue. As usual ED, your attention to details raises potential devils. I’m very willing to believe my thinking on this is too glib, and that the commonsense approach is the wrong one.

If we can get more detailed data I’d be interested to look more deeply at it. I’ll look around.

Finally, I’m not sure what you mean by this;

Could you elaborate a tiny bit more?

Cheers both

Thanks PP.
Sorry not clear. I just meant that the payoff for the big lockdowns is supposed to be in terms of stopping Covid. If the end of the flu weighs on the side of the non-lockdown scenario (as it maybe does depending on the outcome of certain calculations) it’s a big bonus. Especially as most of the world’s Covid deaths seem to be occurring in rich capitalist countries, and many of them are preventable. When you take this into account Covid might not even be worse than flu, for which there is no cure. The absence of discussion of the disappearance of the flu (for which the usual massive vaccination programme will still proceed) speaks volumes - the issue, like Vitamin D, once again left to the Daily Heil to break in the MSM.
Hope clearer. Cheers

This is in reply to @spike’s original post.

It seems such a ‘disappearance’ is easier than one might think.
A while back I looked at the international disease categorisations (IC10 codes, I think) that are used to count diseases, and was unable to separate flu from pneumonia as they appeared to be lumped together ie just one code for ‘influenza or pneumonia’.
Flu deaths are mostly due to pneumonia, but most pneumonia is not due to flu! In addition flu numbers seemed to vary a lot. It seemed that flu deaths might be fiddled - but why would they do that? :face_with_raised_eyebrow:

But then, if they were, surely someone would have pointed that out…

Well it turns out someone did. No less than Dr Peter Doshi, now associate editor of the BMJ.

"NCHS data report the average number of mortalities attributable to influenza on death certificates is little more than 1,000. CDC devises its inflated estimate by deliberately conflating flu deaths with pneumonia deaths. This device is deceitful since most of these fatalities are unrelated to the flu (and therefore, impervious to flu vaccines). In 2005, the British Medical Journal (BMJ) Editor, Dr. Peter Doshi, published a comprehensive rebuke of CDC’s annual ritual of exaggerating flu mortalities entitled “Dissecting CDC’s Deception: Are US Flu Death Figures More PR Than Science?” Doshi accuses the CDC of purposefully inflating flu deaths to frighten the public into purchasing vaccines. To illustrate CDC’s chicanery, Doshi observed that CDC’s announced number of reported pneumonia and influenza deaths in 2001 at 62,034. Yet less than half of one percent of those were actually attributed to influenza. Furthermore, of the mere 257 cases that could reasonably be blamed on the flu in CDC’s mortality data, only 7 percent were laboratory confirmed cases of influenza. That’s 18 lab confirmed influenza cases out of 62,034 “pneumonia and influenza” deaths—or just 0.03 percent, according to HHS’s own National Center for Health Statistics (NCHS).

Subtracting pneumonia, the true number of influenza-associated deaths from 1979 to 2002 averaged 1,348, according to the NCHS data. CNN routinely reports figures forty times this number.

Dr. Doshi charges the CDC with deliberately lying about annual flu deaths to “[work] in manufacturers’ interest by conducting campaigns to increase flu vaccination”. He warns that “by arbitrarily linking flu with pneumonia, current data are statistically biased.”

Doshi wrote a further article in the BMJ online in 2013 " Are US flu death figures more PR than science?"

to which the answer seems to be Yes.
In the BMJ online articles you can view ‘Responses’. A later response by Simonsen for the CDC was given in the BMJ proper, which is paywalled, but Doshi answered it in situ, ie https://www.bmj.com/content/331/7529/1412,
and from the quotes it’s pretty clear that his substance wasn’t challenged.
He was, of course, accused of damaging public health.

Note that the context of the CHD link was a 2020 letter (EDIT: from RFK jr, not Peter Doshi) to CNN’s Sanjay Gupta to counter their smear on him. It’s a detailed rebuttal in the from of a fact check, but it’s also a comprehensive indictment of the ‘science’ surrounding the flu jab.

It would seem from this that flu deaths are hyped up a couple of notches on the Richter scale.

But what about covid? Well the smoking gun may not be in view, but pneumonia was a large part of covid deaths in 2020. As there was supposed to be a panicdemic, and there was no code for covid, simply counting the pneumonia deaths as covid, for example, would have edged out the flu part.

1 Like

This gets even more interesting when you look at the percentages of people thought to have 'flu who were lab tested for 'flu - in the UK in January 2019 93.75% were lab tested this dropped to 51.9% in January 2020 BUT by May 1st 2020 this had dropped to 0.11% and in August 2021 dropped further to 0.03% ! per :

[

Monthly share of influenza tests that were positive

](Influenza Data Explorer - Our World in Data)

In other words just like the results of the 9/11 NIST investigation into the use of explosives - if you don’t look you’ll never find!

Obviously it gets worse if you subject the 'flu “tests” to the same scrutiny we have seen of the covid “tests” - both using PCR to some degree!

cheers

1 Like

Hi @CJ1. Good move.
I think that’s the percentage of tests that were positive!? I can’t find the numbers of tests.or the proportion.

If the proportion of tests that are positive dropped almost to zero in western countries after Jan 2020, I dont know how to interpret that!
Could be that due to covid many countries stopped flu testing.

Your rodenty sense is tingling about the tests - the answer may be there.
From memory of what I read when I was scouring around recently, there are hundreds of flu viruses - when they bring out a new vaccine it only targets one or two. And most influenza-type viruses (assuming they are viruses, of course :wink:) aren’t influenza, I think.

Then there’s PCR and attendant issues…

So it could be there the data contans little value anyway. :astonished:
Just watch what the people in power are up to :wink:. We can make special dispensation to reverse the board guidelines for flu data - only adhom is allowed!

Cheers.

1 Like

It’s quite interesting the way “information” is handed out in this way. The words used are not entirely explained -

The headnote of the graph:

"Monthly share of influenza tests that were positive

People who were tested had a respiratory infection with a fever, cough and onset within the last 10 days. Only a fraction of potential cases of influenza are tested by labs to confirm whether they have influenza and to identify their strain. The level of testing may vary between countries and over time."

From the above I conclude:

  • this only shows the percentage share of positive tests out of all tests in the month.
  • no indication of all potential cases of 'flu.
  • level of testing varies between countries and over time without any indication of reasons for this.
  • no indication of the type of tests used ( or cycles used in a PCR test).
  • no indication of numbers of people being tested ( more than one test per person?).

Footnote:
"Note: The share of positive tests is calculated by dividing the number of tests that were positive to any flu strain by three possible denominators, based on data availability. If both values are available then the denominator is the sum of positive and negative tests; if not then the number specimens processed is used; if neither of those are available then the number of specimens received by the testing facility is used.

  • so the data seems to include:
  1. positive test numbers
  2. total number of specimens received for testing
    -the data may also include:
  3. the total number of specimens processed
  4. negative test numbers

So roughly the percentage shown in the graph is the share of positives out of the total number of specimens received ( or tested, or the total of both positive and negative numbers) for any day in the month.

To compare one day to another within one jurisdiction maybe comparing apples and oranges as there is no uniformity of definition of what amounts to a positive for 'flu or what tests are used from day to day. Nor is there any indication of what the share of positives are to the total number of “potential 'flu sufferers” the graph only shows the share of positives to the total tested.

To make it clearer in my earlier post I should have said :
"- in the UK, for the month ending on 1st January 2019, 93.75% of all specimens received for a 'flu test were positive, dropping to 51.9% on 1st January 2020, dropping further to 0.11% on 1st May 2020 and finally dropping to 0.03% on 1st August 2021 "
…BUT I should clearly have noted the total NUMBER of positive cases for the month on each of the following dates are far more revealing:
1.1.2019 - 12,119
1.1.2020 - 5,218
1.5.2020 - 2
1.1.2021 -60
1.8.2021 - 7
1.1.2022 - 527

  • given 'flu seems to be a seasonal illness I should not have included the May and August outliers at all in the first post!
    1.1.2021 and 1.1.2022 are more instructive numbers when comparing them to 1.1.2019 and 1.1.2020!
    see this table:
    Influenza Data Explorer - Our World in Data

Was it Ivor Cummins who said that the chances of 'flu numbers dropping off the cliff as they did in the winter of 2020/2021 were enormous?

  • I didn’t look at the US numbers but they are shown in the tables above by clicking on the country.

So basically I’m just confirming what you already posted, I think :confused:

cheers

1 Like