Odd how the world has turned inside out. Here I am avidly reading articles on a website called Conservative Woman which mere months ago I would have assumed was devoted to quince preserves, fox hunting, the wicked migrants spoiling things for nice people, and turning a blind eye to one’s husband’s philandering. More fool me.
Really sound material, thanks for the link @Kieran_Telo .
Dr. Yeadon should stick to the written word, he comes across rather weak in interviews, imo. This article is one of the clearest and most authentic pieces I’ve read on this scam for a long time.
The Conservative Woman - I only go there for the intersectionality
There’s quite a lively debate going on underneath.
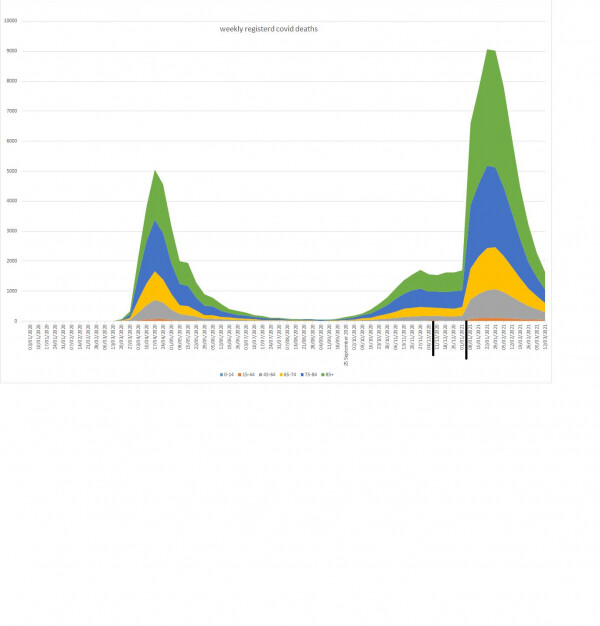
Here’s a thing, though: Mr Cheerful says, referring to the graph underneath of weekly registered deaths by age group:
“Recent spike - the peaks for all ages align vertically, whereas they were vaccinated over a couple of months, so should be spaced out…if the vaccine was responsible for the drop.
It can not have been for the first spike.”
So the graph is right.
The peak death week for each age groups is the same.
The data says it was 29 Jan 2021.
Now isn’t that strange - all the age groups peaking on the same week…
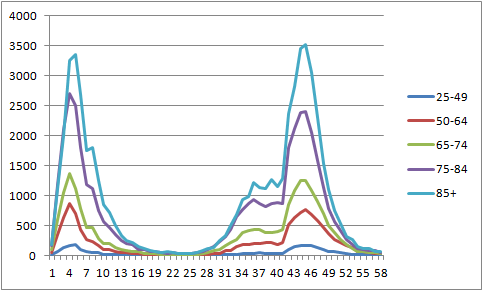
BTW I left out the 0-29 age group as it has so few deaths. The second peak (6 deaths) was just a week later.
The graph indicates it was virtually the same in the first peak - with the age ranges peaking during week 4 or week 5.
For all the age ranges to peak the same week implies the factor(s) causing the deaths to come down applies equally to all ages. Even if the main reason was lockdown, you would expect some differences across all the ages.
But if lockdown looks unlikely to have caused this coincidence, it’s extremely hard to see how it can be the vaccines! Staggered as they were, by age.
In Mr Cheerful’s graph the peak of the first wave is wrongly shown as being much smaller than the second. I think that’s just an error - maybe due to the data for Males, Females and Totals being together, and picking the wrong one for the graph.
This doesn’t affect his excellent point.
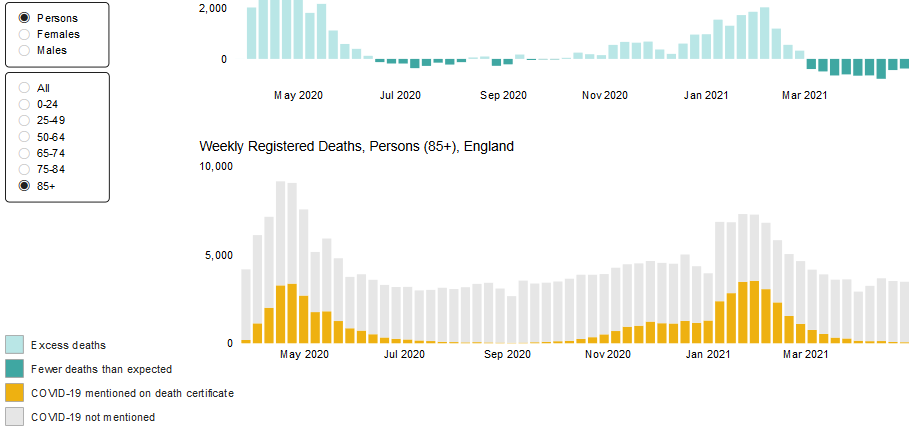
Here’s the ONS graph for the 85+ age group, you can see the two covid deaths peaks (yellow) are about the same.
I wish I was not quite so socially phobic as Yeadon is speaking at Canterbury later today (Sat 15 May) and that’s an easy 20 min journey from here.
But it is what it is.
Thinking back, there was definitely something going on in the first few weeks of 2021, the ambulance queues and heightened hysteria felt to me as though they were added to the mix to ‘prove’ the wisdom of cancelling Christmas. The stats seem to mirror this amazingly. The desired behaviour change seemed to be reflected in the rush to get jabbed, and so on. (The PCR M.O. was tweaked to produce the desired case figures.)
Here we are in May with a ‘milestone’ imminent but the ‘next wave Wendys’ are restless (see the WSWS for US-centric examples…). Jab mania seems to have stalled. The response: go out fishing for cases.
Bolton seems to be the focus for this, at the moment.
Beware the Indian variant! IT’S ALREADY HERE! ALARM, ALARM! REFLOAT THE MOCKDOWN MEME! (even though the ‘Ultimate horror in India- aaagh!aaagh!’ bs-blizzard seems to be stalling, as it becomes clear that chronically-badly-governed India has such murderous feck-ups periodically, without need of any invented pandemic.
Gotta keep an eye on those Seff Efrikan germs though, might be using the Indian variant as cover for a sneak attack on Canvey Island, Anglesey, or Isle of Wight, as no doubt happened in Seychelles