Hi PP. Thanks for your considered reply.
Ramblin’ posts, ramblin’ posts. Where they take us, no-one knows…
Mad distractions, stats and ghosts. But my body’s no vaccine host.
(Nat King Cole, not quite.  )
)
I’ll probably answer in two parts if that’s OK as I wish to defend my key point, and it might be useful to reach agreement at least on where we stand on it.
“This is an interesting observation for sure. I’m not sure that you can draw the conclusion that therefore covid deaths are inflated, however. It could be, for example, that certain other causes of death in regular years were affected by the restrictions that people lived under last year. Behavioural changes, for example, might well have caused a reduction in normal baseline mortality. Wearing masks and social distancing seems to have wiped out the 'flu, for example. Far fewer people commuted last year than previously is another example. It would require some pretty detailed work to disentangle the effects of the various lockdowns and other restrictions on mortality, but I don’t think we can go straight to “a portion of covid deaths aren’t caused by covid” from this data. I know that there are folks who believe that the lockdown actually caused a large number of deaths, but I have yet to see any evidence of that.”
This is a clear point of disagreement as I think you can draw that inference that covid deaths in the second wave are inflated.
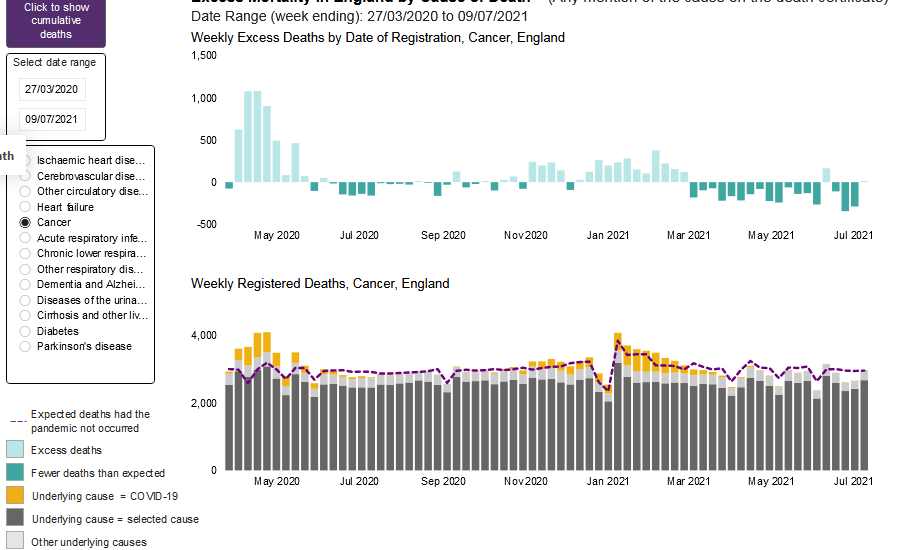
My point is that if covid played a role in these deaths then it follows that if there was no covid the people wouldn’t have died. But the presence of yellow ‘covid’ deaths under the dotted line show that if all the covid (yellow) were removed there would be an unexplained, significant drop in deaths. Therefore in this scenario, too many of the yellow deaths have been removed and so those in question - below the dotted line - should not be counted as covid deaths.
Doesn’t your alternative explanation - that restrictions or behavioural changes affected the deaths - still refer to a class of deaths that would not exist had there been no covid?
So I have to stick to this claim. I first put this to the board at least a couple of months ago no it’s not a new rush of blood! I’ve thought about it a lot - if I’m wrong somebody will have to show me my blind spot. To repeat, it is that it can be inferred from the graphs that covid deaths after November/December are inflated
But there are several other unusual factors that support this explanation, and if my explanation is wrong they therefore require another explanation.
-
The covid deaths in last years’ peak are all above the dotted line, the five-year average.
-
Further, in this period in the UK they were only testing people who were actually ill (unlike the second wave where there must necessarily be far more positive tests from people who HAD covid previously). That sets up two scenarios, one where covid is not over counted and one where it is. The unusual position of the dotted line during the second wave is compelling confirmation.
There is a further factor. Just to incorporate a point you make later:
“I know that there are folks who believe that the lockdown actually caused a large number of deaths, but I have yet to see any evidence of that.”
More precisely, is your point that there must be some, but data haven’t been gathered?
Nevertheless I think there is clear evidence of non-covid deaths from covid policy. There is more in these ONS graphs, which leads to my third factor:
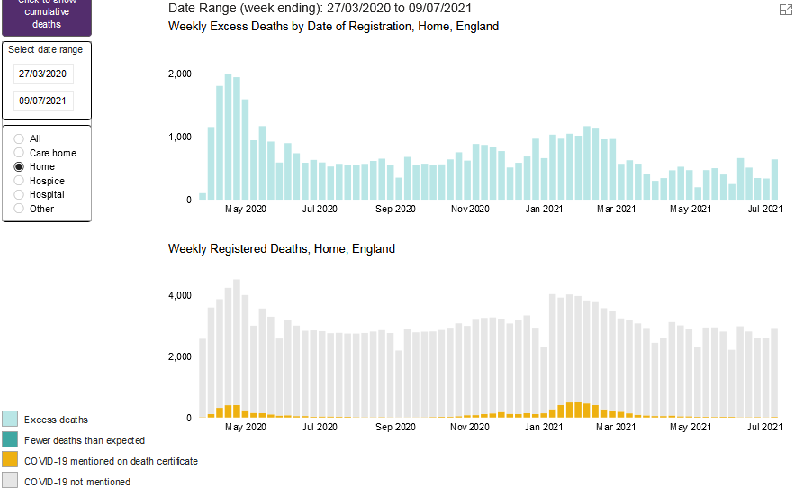
- The graphs have consistently shown there is a high number of excess deaths at home - averaging about 600-700 per week. To verify this you need to go to the link and click through the pages to page 9. This shows deaths by place of death. Then you have to select ‘Home’. You then get this graph:
Link: https://app.powerbi.com/view?r=eyJrIjoiYmUwNmFhMjYtNGZhYS00NDk2LWFlMTAtOTg0OGNhNmFiNGM0IiwidCI6ImVlNGUxNDk5LTRhMzUtNGIyZS1hZDQ3LTVmM2NmOWRlODY2NiIsImMiOjh9
(Edit: referring to upper graph, weekly excess deaths at home. Also the right graph now showing, soz).
This is a lot of deaths over a year. It falls a bit after March this year but totals more than 30,000 deaths. The apparent fall from March will have been affected by the onset of covid last year.
Crucially, these excess home deaths aren’t covid deaths! You can see that from the fact they continued unabated from July to October when the lower graph shows there was hardly any covid.
Nor were they counted as covid deaths. But they must be related to covid in some way. If not lockdown, then delayed hospital treatments. For my point, it doesn’t matter which. There are plenty of deaths not from covid, but from effects of covid on policy or people’s behaviour.
In summary (of this key point) when you include misattributed covid deaths and also home deaths (which evidently aren’t due to covid) this is a big chunk of the excess deaths in the second wave.
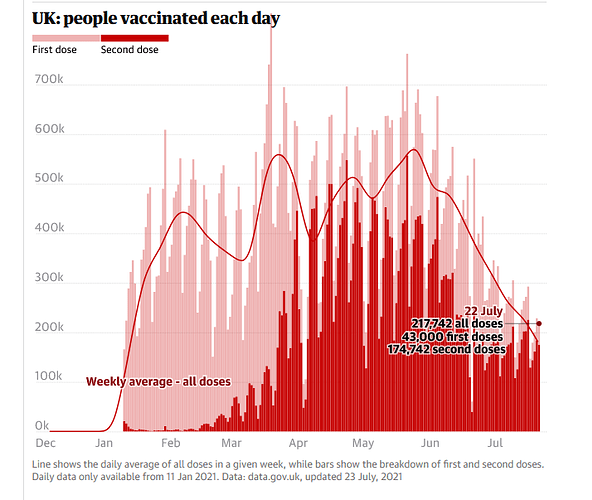
This means that there is plenty of room for a number of vaccine deaths that rivals or actually exceeds the number of covid deaths, which themselves, I argue, are inflated in the second wave.
(I should say that although I say the covid deaths were counted ‘correctly’ in the first wave I only mean this was correct as far as the admin and covid defintions in use were concerned. In my view the second wave shows up the bricked-in flaws in this counting process)
Cheers
ED


 Cheers bro!


 froze the rolling average to some point in 2019. I didn’t fully grasp the nuance but likelihood is there was some leaning on